
Figure 2. Performance of TPS using different sizes for the selected points.
Error comparisons of TPS variants to uniform selection of points and noise. Absolute difference - Greedy iterative addition with absolute difference initialization (Algorithm 1, Appendix Methods). Simulated annealing - Iterating using simulated annealing with absolute difference initialization. Weighted error - Selection based on cluster rather than individual gene errors. See Appendix Methods for details.

Figure 2—figure supplement 1. Average noise in each mRNA expression time point.
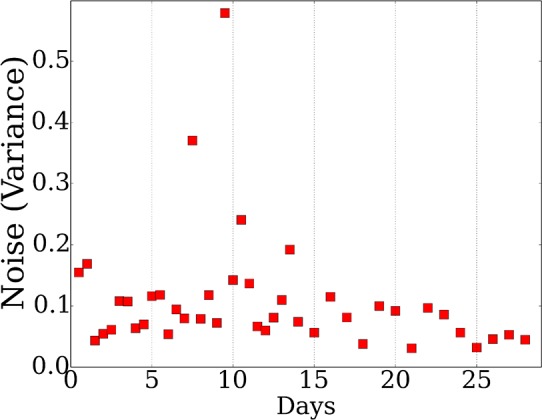
Figure 2—figure supplement 2. Comparison of error for the TPS algorithm on full data, 75% random data, and random points chosen on the full data.

The 75% random data was created by replacing 75% of the gene time series with random value time series selected from a Gaussian distribution with mean 0 and standard deviation equal to the noise of the original data.
Figure 2—figure supplement 3. Comparison of TPS and piecewise linear fitting over genes (a) Pdgfra, (b)Eln, (c) Lrat.

Figure 2—figure supplement 4. Comparison of the reconstruction error when using the points selected by TPS and when using the same number of random points from the overall set of sampled points.
