
Figure 4. Performance of TPS by on the miRNA data.
(a) TPS reconstruction error when using the mRNA data to select time points for the miRNA experiments. Results of random and uniform selection as well as repeat noise error are also presented for comparison. TPS variants shown are the same two presented in Figure 2. (b) Error of splines with points selected by training TPS on the actual miRNA data itself, using the maximum absolute difference initialization.

Figure 4—figure supplement 1. Observed and reconstructed expression proles for miRNAs (a) mmu-miR-100, (b) mmu-miR-136,c) mmu-miR-152, (d) mmu-miR-219.

Figure 4—figure supplement 2. 8 stable miRNA clusters.
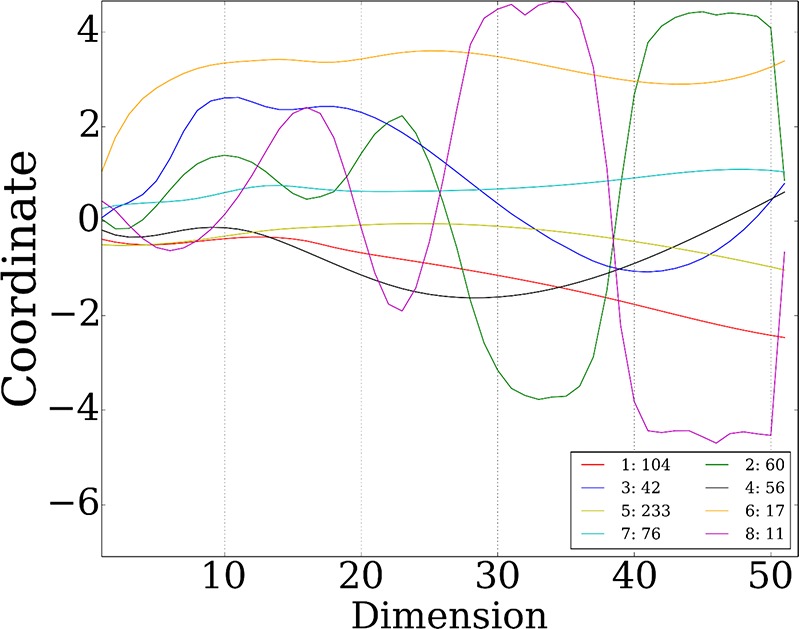
Figure 4—figure supplement 3. TPS performance for the proteomics data using different number of time points.

(a) Comparison of the reconstruction error when using the points selected by TPS, uniform selection of points, and when using the same number of random points from the overall set of sampled points. (b) Error comparisons of TPSto noise, and various search and initialization options discussed in Methods.