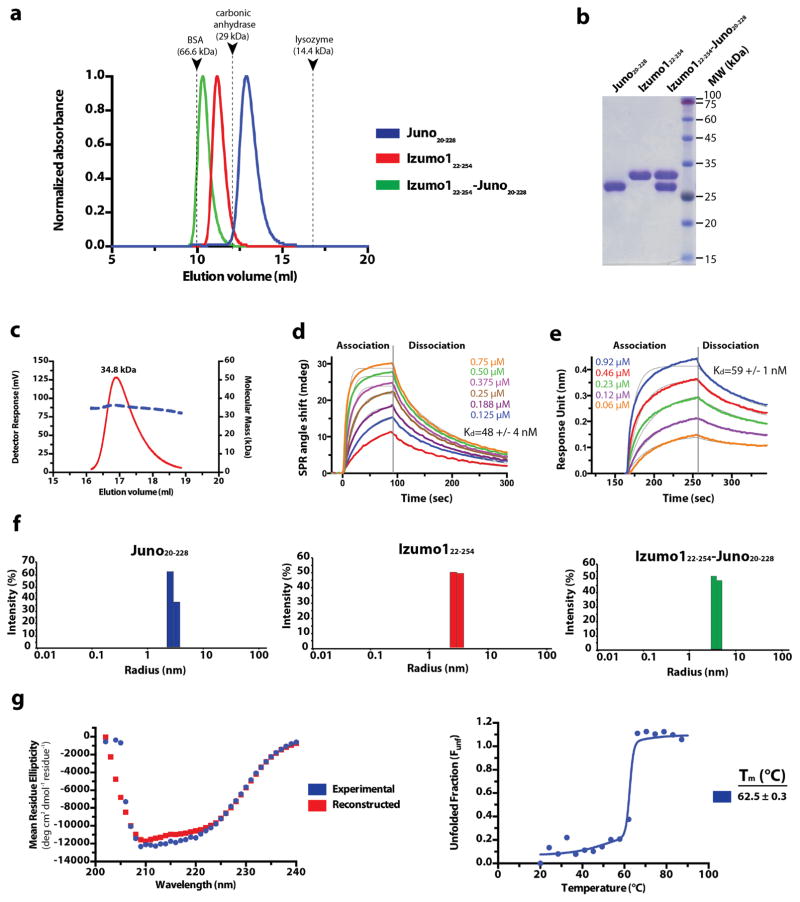
Extended Data Figure 3. Purification and characterization of Izumo1 and Juno.
(a) Superdex-75 10/300 GL size-exclusion chromatograms of Juno20-228, Izumo122-254, and the Izumo122-254-Juno20-228 complex. Eluted peak positions of protein standards are marked with triangles and dashed lines. (b) Coomassie-stained SDS-PAGE analysis of the purified Izumo122-258, Juno20-228 and Izumo122-258-Juno20-228 complex. For gel source data, see Supplementary Figure 1c. (c) SEC-MALS profile of glycosylated human Izumo122-268. The detector response unit (mV) and molecular mass (kDa) are plotted against the elution volume from a Superdex-200 Increase 10/300 GL size exclusion column. SEC-MALS reveals an apparent molecular weight (MW) of 34.8 kDa (dashed blue line), which corresponds to a monomeric species. (d) Surface plasmon resonance (SPR) binding affinity and kinetic analysis of the human Izumo122-254 and Juno20-228 interaction. Human Juno20-228 was amine-coupled to the SPR sensor chip. Kinetic parameters were derived from a Langmuir 1:1 binding model. (e) Biolayer interferometry (BLI) kinetic analysis of the human Izumo122-254 and Juno20-228 interaction. Human Juno20-228 was biotinylated and coupled to streptavidin-coated biosensors. Kinetic parameters were derived from a 1:1 binding model. The experimental curves are shown in colour superimposed with the fitted curves indicated as gray lines. (f) A size distribution histogram from dynamic light scattering (DLS) measurements of Izumo122-254, Juno20-228 and Izumo122-254-Juno20-228 complex at 5 mg ml−1. Izumo122-254, Juno20-228, and Izumo122-254-Juno20-228 displays a hydrodynamic radii (RH) of ~3.0 nm, ~2.9 nm, ~3.9 nm, respectively. (g) Circular dichroism (CD) wavelength scan of human Izumo122-268 (blue) at 25°C shows mixed secondary structural characteristics. The crystal structure of Izumo122-268 aligns well with the secondary structural content calculated from the CD spectrum (35% α-helical, 24% β-strand, and 41% random coil) from the CD spectra. A reconstructed CD wavelength scan (red) illustrates the agreement of the fit used in secondary structural content analysis. CD thermal denaturation profile of human Izumo122-268 at 222 nm is shown. CD signal was normalized between 0 (folded) and 1 (unfolded), and plotted as a function of temperature. The Tm value indicates the midpoint of the melting transition.

