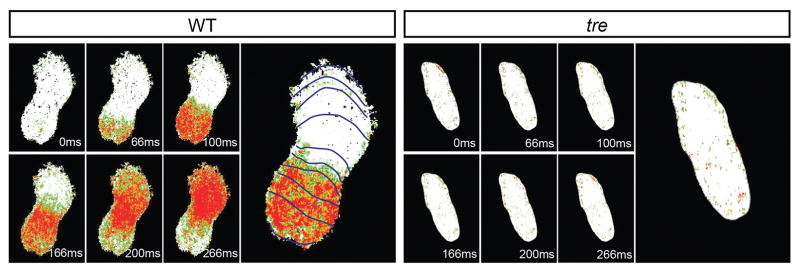
Figure 10.
Optical mapping of cardiac conduction reveals aberrant calcium excitation in tre mutants. Sequence of heat map images depicts calcium activation in a wild-type (WT) heart expressing Tg(myl7:gCaMP) at 36 hpf; isochronal lines represent every 33 milliseconds. In WT embryos, calcium activation initiates in the sinus venosus (bottom) and concludes in the ventricle (top). In contrast, heat map images from a tre mutant heart indicate that only sporadic calcium activation occurs in the absence of Ncx1h function. Adapted from Shimizu et al. (2015).

