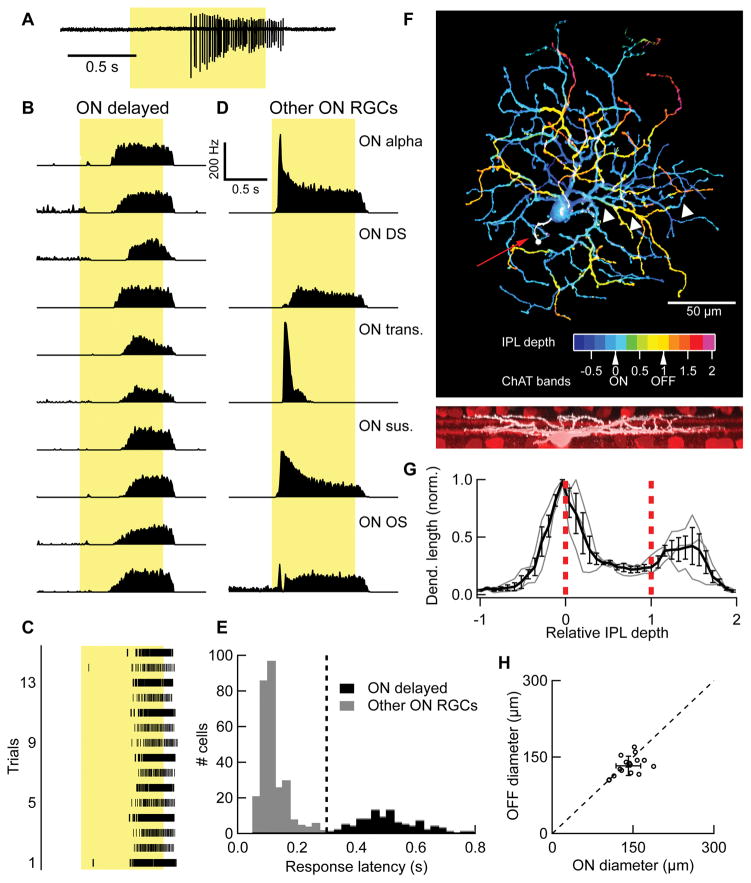
Figure 1. Light response and morphology of the OND RGC.
(A) Light response of an OND RGC to a spot of light 200 μm in diameter, at 100 R*/rod/s presented from darkness (“Light Step”). Cell-attached spiking response in a single trial. Duration of stimulus presentation denoted by yellow rectangle here and elsewhere. (B) Peri-stimulus time histogram (PSTH) for 10 representative OND RGCs responding to the light step stimulus, 10–20 trials each. (C) PSTH of spike activity in response to the light step stimulus in representative examples of 5 other RGC types computed from 10–20 trials each. ON DS, ON direction selective; ON OS, ON orientation selective; ON trans., ON transient; ON sus., ON sustained. (C) Spike raster showing individual trials of an OND RGC responding to light step. (E) Distribution of half-maximum latency in response to light step across a sample of 382 RGCs containing ON, non-direction selective cells. Vertical line, classifier of OND cells at latency = 0.3 s. Cells to the right of this line are OND cells (black), whereas cells to the left of this line are not (gray). (F) Top, maximum projection confocal image of an OND RGC. Color scale represents depth within the inner plexiform layer (IPL). Red arrow points to axon stub (white). White arrows point to a recursive dendrite. Arrows below color scale denote IPL depth of the ON and OFF ChAT bands. Bottom, side view of the same cell, same scale (white) along with starburst amacrine cells and ChAT bands (red). (G) Dendritic density profile. IPL depth is in normalized coordinates where 0 and 1 correspond to the ON and OFF ChAT bands, respectively (red dashed lines). Gray lines, individual cells; Black, mean density ± SEM (n = 3 cells). (H) Equivalent diameter of the dendritic fields of the ON and OFF strata of OND RGCs (see Experimental Procedures). Empty circles, OND cells; filled symbol and error bars, mean ± SD. (n = 16 cells). Dashed line is the line of equal ON and OFF dendritic diameters. See also Figures S1, S2.

