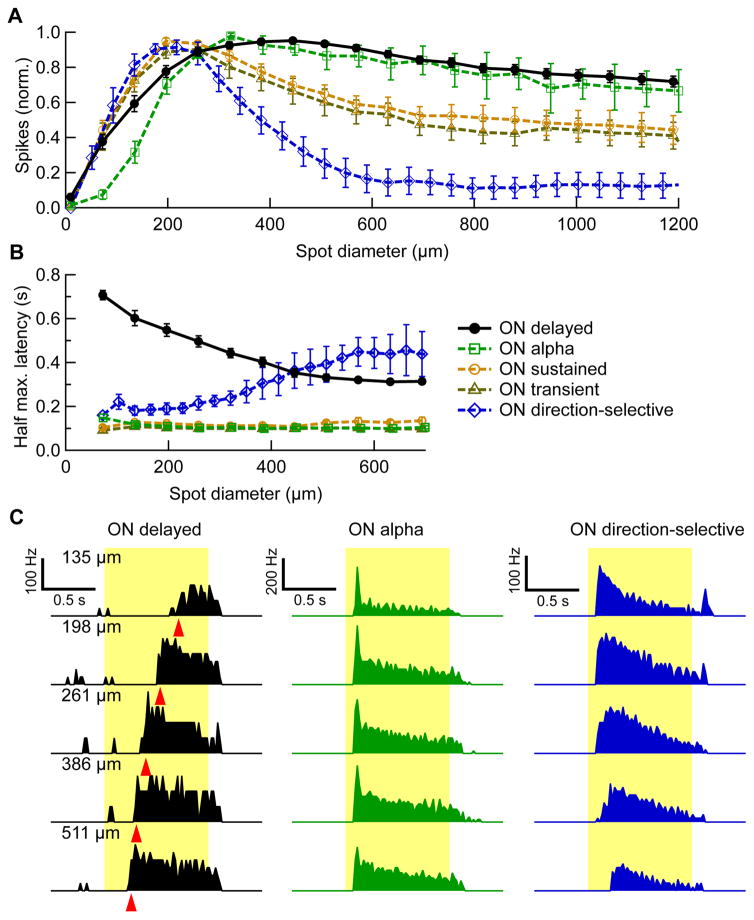
Figure 2. Response latency and spike count as a function of stimulus size.
(A) Spike count during stimulus presentation vs. spot diameter, normalized by its maximum (average ± SEM over cells within each group). Numbers of cells: OND n = 16, ON alpha, n = 4, ON direction-selective, n = 6, ON sustained, n = 13, ON transient, n = 9. (B) Half maximum latency vs. spot diameter (average ± SEM over cells within each group). (C) PSTH of an OND RGC (black), ON alpha RGC (green) and a ON direction-selective RGC (blue) in response to spots of different sizes. Spot sizes are denoted on the upper left of each row. From PSTHs, spike count and latency were extracted. Red triangles, half maximum latency for the OND PSTHs. See also Figure S3.

