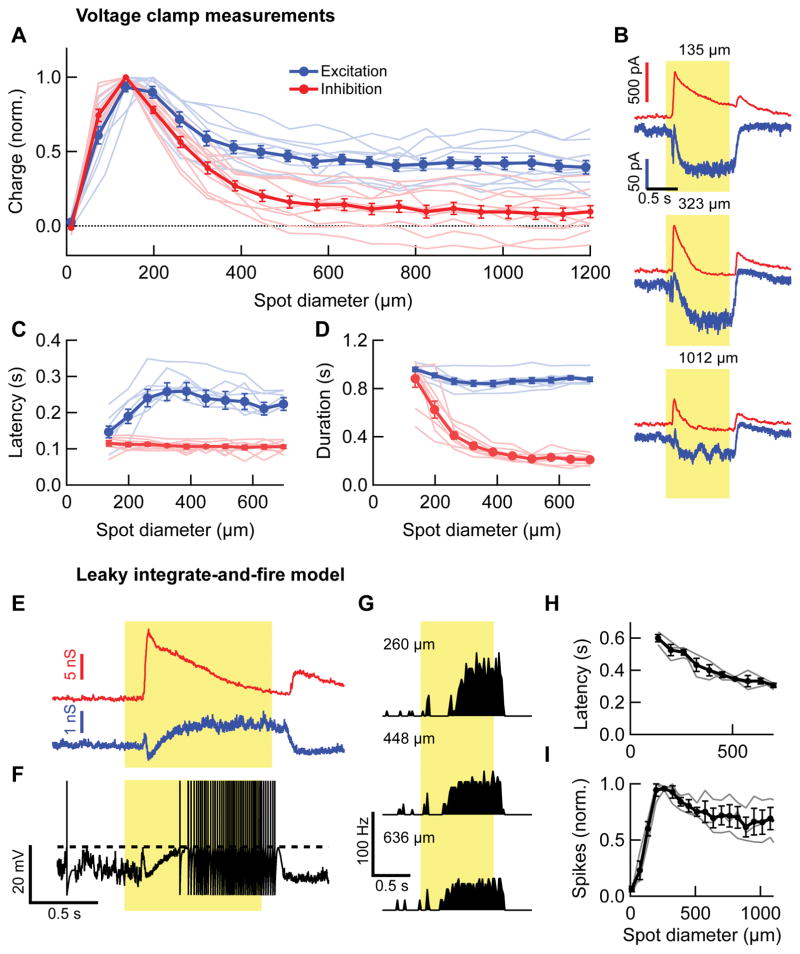
Figure 3. Stimulus size dependence of synaptic currents in OND RGCs and Leaky integrate-and-fire model.
(A) Total charge of excitatory (blue, n = 10 cells) and inhibitory (red, n = 11 cells) currents in OND RGCs, normalized by their maximum, as a function of spot diameter. Thin lines are individual cells, thick lines are mean ± SEM throughout figure. (B) Excitatory and inhibitory currents as a function of time, measured in an OND RGC for three different spot sizes, denoted above each panel (mean traces over 3 trials, same colors as in main figure). From current time traces, charge, latency and duration were extracted. (C) Latency of excitatory (blue) and inhibitory (red) response currents as a function of spot diameter. Inhibition was earlier than excitation: spot diameter ≥ 197 μm, p < 0.0013, one-tailed paired t-test. (D) Duration of excitatory (blue) and inhibitory (red) response as a function of spot diameter. Inhibition was more transient than excitation: spot diameter ≥ 197 μm, p < 0.0017, one-tailed paired t-test. (n = 8 cells in (C, D)). (E) Excitatory (blue) and inhibitory (red) synaptic conductances in an OND RGC in response to a 200 μm diameter spot, obtained directly from measured synaptic currents (such as those in (B)), and fed into the leaky integrate-and-fire model. (F) resulting simulated membrane potential, using conductances in (F). Dashed line is the spiking threshold. (G) Simulated PSTH for different spot diameters that are denoted on the left. Each PSTH was calculated from the spiking in 12 simulated trials. (H) Simulated spike count vs. spot diameter for three different OND cells (thin lines); thick line, average curve ± SEM. (I) Half max latency vs. spot diameter, measured for the same cells and simulated PSTHs as in (H). Thin line, individual cells, thick line, average ± SEM (n=3 cells).

