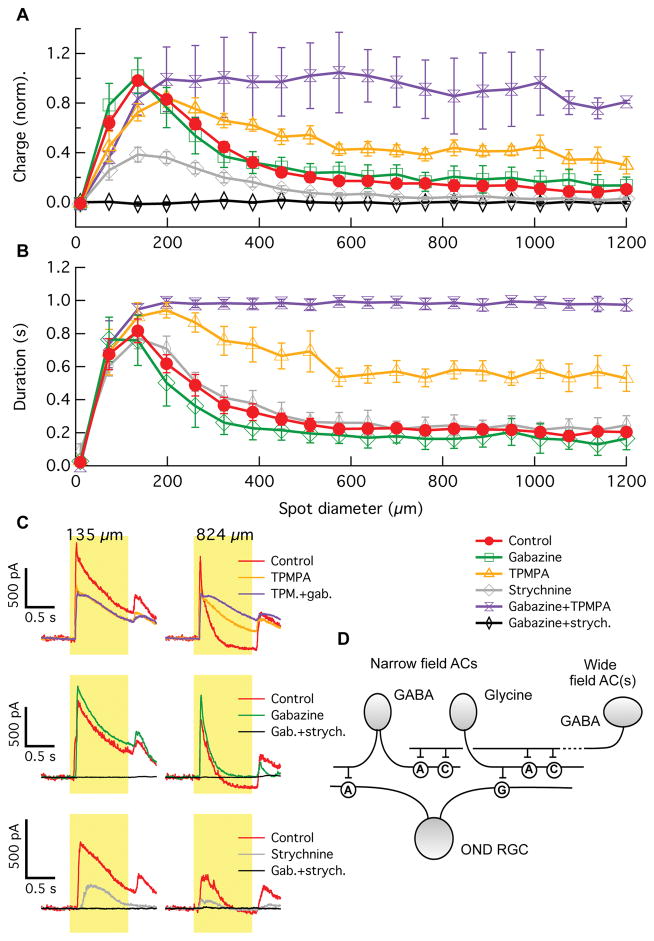
Figure 4. Stimulus size dependence of synaptic inhibitory currents of OND RGCs in the presence of synaptic blockers.
(A) Charge of the inhibitory current in OND RGCs vs. spot diameter, in control condition (red, 8 cells), in the presence of gabazine blocking GABAA receptors (green, 4 cells), TPMPA blocking GABAC receptors (orange, 4 cells), strychnine blocking glycine receptors (grey, 3 cells), TPMPA+gabazine (purple, 3 cells), and strychnine+gabazine (black, 4 cells). (B) Duration of inhibitory current in OND RGCs vs. spot diameter, measured as the time the current was > 25% of its maximum value (see Experimental Procedures). Colors of curves are as in (A). Curves are mean ± SEM over cells in (A, B). (C) Traces of inhibitory current vs. time in OND cells, measured for two different spot sizes denoted above. Colors of traces are as in (A). Each trace is an average over three trials. (D) Diagram of circuit model to explain results in (A–C). AC = amacrine cell; neurotransmitters produced by ACs appear next to somas. ‘A’, ‘C’ and ‘G’ are synapses containing GABAA, GABAc, and glycine receptors, respectively. See also Figure S4.

