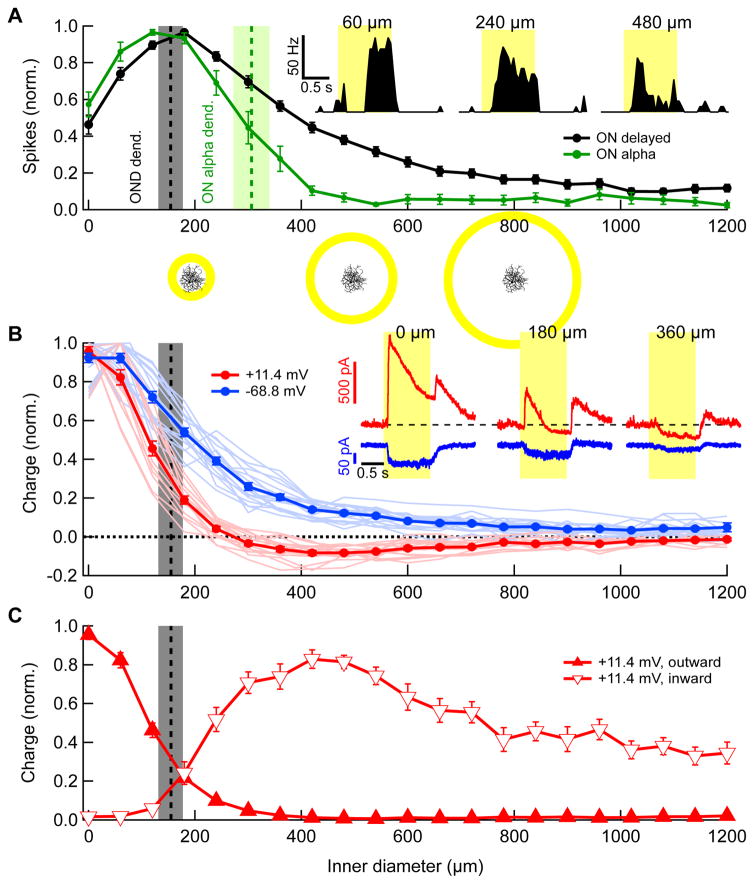
Figure 5. Responses of OND to light annuli with varying diameters.
(A) Spike count during stimulus presentation (normalized by maximum) vs. inner diameter of a bright annulus of constant 60 μm width, shown for OND (black, n = 20 cells) and ON alpha RGCs (green, n = 6). Curves represent mean over cells ± SEM throughout figure. Maximum absolute numbers of spikes were 49 ± 2 and 98 ± 11 in OND and ON alpha RGCs, respectively. Vertical bars in (A, B) are dendritic diameters of OND and ON alpha (mean ± SD, OND cells, n = 18; ON alpha cells, n = 3). Stimulus schematics along with an OND cell are shown to scale below corresponding values on horizontal axis. Inset: PSTH for three different annulus inner diameters, denoted above. (B) Total charge of synaptic currents in OND RGCs vs. inner diameter of annuli, measured at a holding voltage of −68.6 mV (blue) and +11.4 mV (red) and normalized by their maximum. (−68.6 mV, 18 cells, +11.4 mV, 15 cells). Inset: currents vs. time at holding voltages of −68.6 mV and +11.4 mV in an OND cell for three different annulus inner diameters, denoted above (mean traces over 3 trials, colors as in main panel in (B)). (C) Charge caculated and normalized separately, for the outward (open symbols) and inward (closed symbols) components of the currents, at a holding voltage of +11.4 mV.

