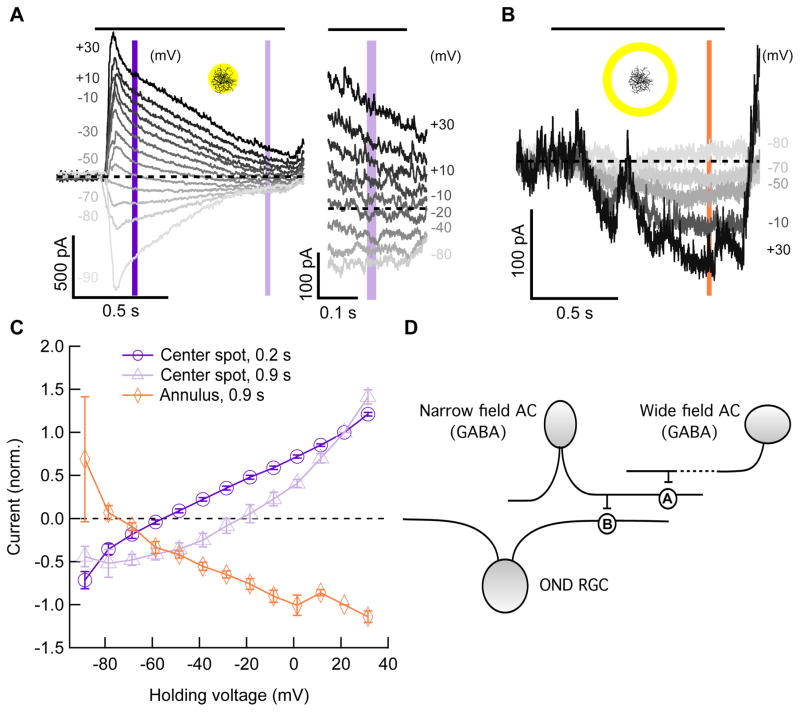
Figure 6. Current-voltage relationships in response to a spot and annulus.
(A) Left, currents vs. time at different holding voltages in an OND RGC, in response to a center spot of light (200 μm, 200 R*/rod/s from dark). Right, same currents as on left panel, zoomed in on last 0.2 s of presentation of spot. Curves for some voltages were omitted for clarity. Horizontal black bar above panel, time of stimulus presentation. Dashed line, zero current. Vertical purple bars denote time points used in panel (C). (B) Currents vs. time at different holding voltages in an OND RGC, in response to a light annulus (400 μm inner diameter, 520 μm outer diameter, 200 R*/rod/s from dark; 7 cells). Vertical orange bar, time point used in panel (C). Insets in (A, B), light stimulus schematics. (C) Current vs. holding voltage curves (mean ± SEM, 7 cells) at time points 0.2 s (dark purple) and 0.9 s (light purple) in response to a center spot of light as in (A), as well as a similar curve taken at time point 0.9 s, in response to a light annulus as in (B). (D) Diagram of model for circuitry to explain the extra-dendritic current (B,C) and the elimination of it by blocking GABAA and GABAB receptors (Figure S5). See text. AC = amacrine cell; ‘A’, synapse containing GABAA, receptors; ‘B’, synapse containing GABAB receptors, providing tonic inhibition onto the OND RGC. See also Figure S5.

