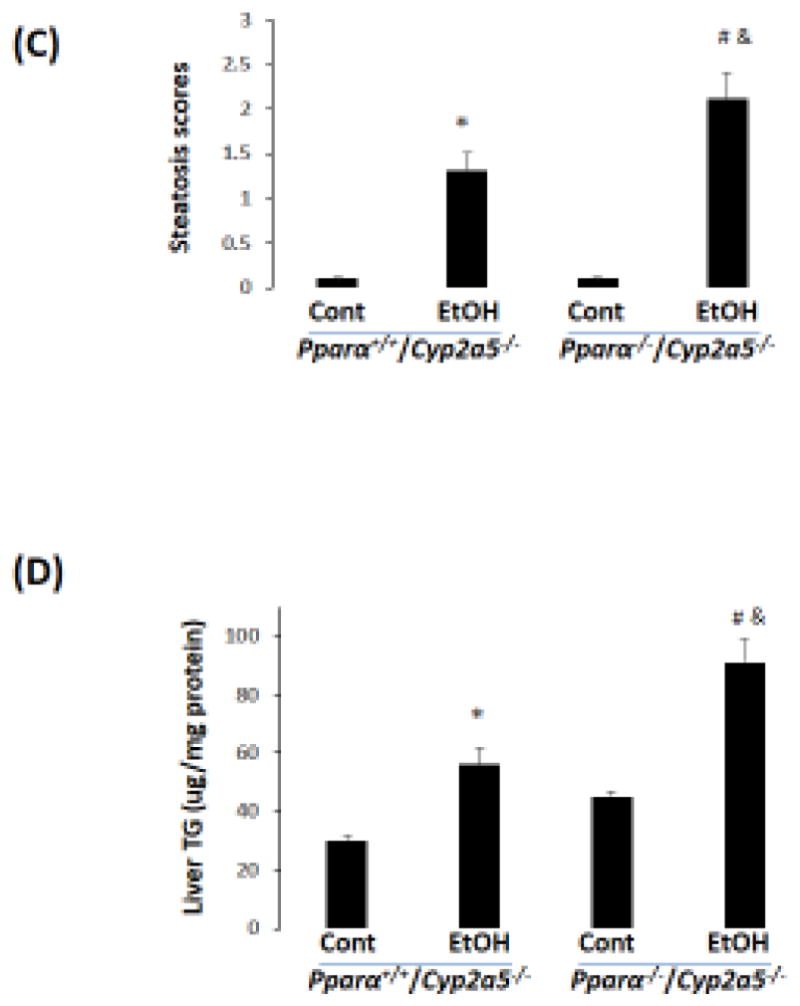
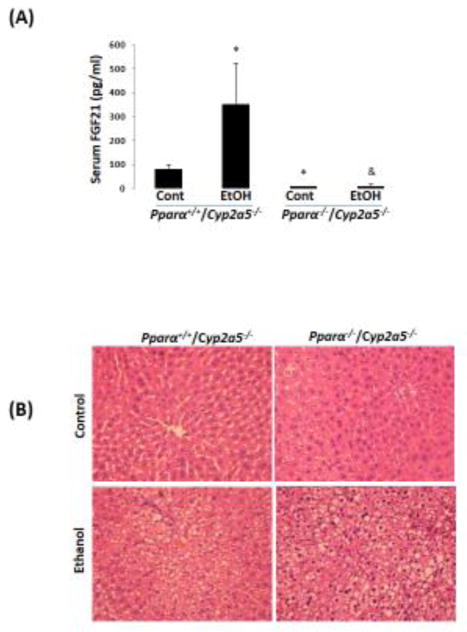
Figure 6.

Alcoholic fatty liver is more pronounced in Pparα−/−/Cyp2a5−/− mice than in Pparα+/+/Cyp2a5−/− mice. (A) Ethanol induction of FGF21 was blunted in Pparα−/−/Cyp2a5−/− mice (N=4). (B) H&E staining in liver sections shows that alcoholic fatty liver was more pronounced in Pparα−/−/Cyp2a5−/− mice than in Pparα+/+/Cyp2a5−/− mice. (C) Steatosis scores (N=5). (D) Liver TG contents (N=5). *P<0.05, compared to Pparα+/+/Cyp2a5−/− Control Group. # P<0.05, compared to Pparα−/−/Cyp2a5−/− Control Group. & P<0.05, compared to Pparα+/+/Cyp2a5−/− Ethanol Group. Cont, Control; EtOH, Ethanol.

