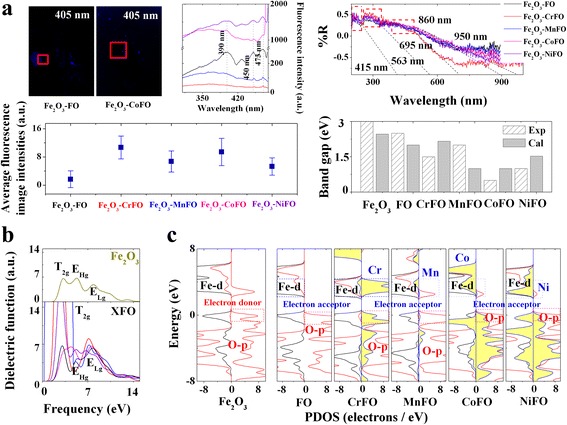
Fig. 2.

a Fluorescence images, average luminous intensities, and PL patterns of Fe2O3–XFe2O4 by the excitation of 405 nm. b reflects the DRS patterns and confrontation between experimental and calculated band gaps of Fe2O3–XFe2O4. The absorption bands were tested through the slopes of diffuse reflectance curves that the experimental and calculated band gaps are similar with each other. c shows the calculated dielectric functions and spin-PDOSs of Fe2O3–XFe2O4
