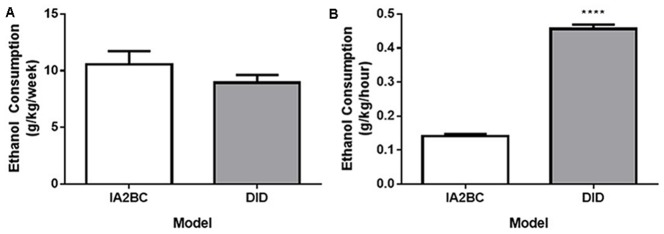
Figure 3.
Comparison of weekly and hourly ethanol consumption using the IA2BC and DID models. (A) Rats consuming 20% ethanol using the DID (gray) and IA2BC (white) model consumed similar amounts of ethanol per week. (B) However, the average amount of ethanol consumed per hour was greater for rats using the DID model compared to the IA2BC model n = 8 per group. Two tailed unpaired Student’s T-test. ****p < 0.0001 compared to IA2BC rats.

