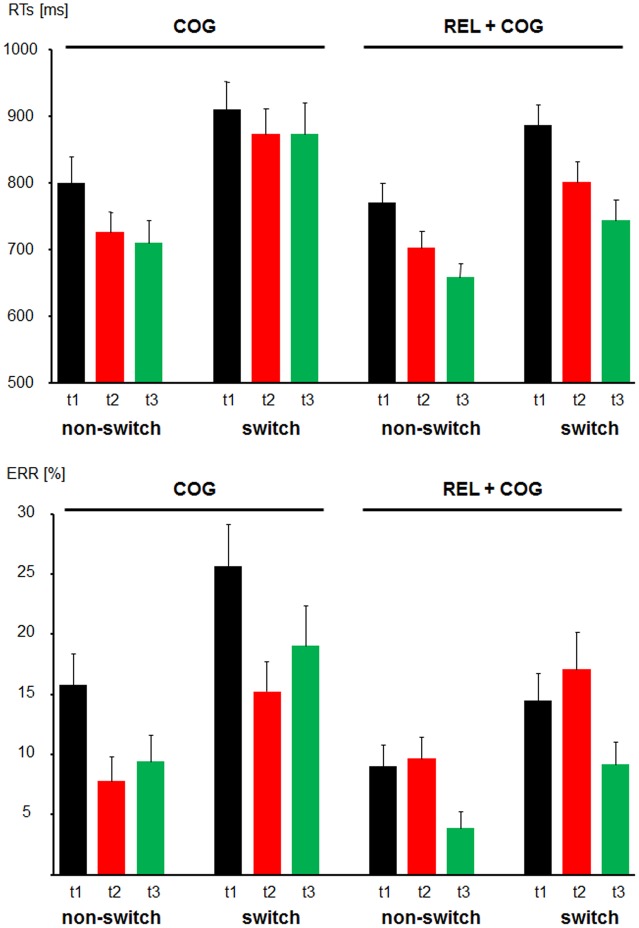
FIGURE 3.
Behavioral data. Reaction times (Top) and error rates (Bottom) as a function of Task-Set Transition (non-switch and switch) in the Cognitive Training Group (between t1 and t2; COG) and Waiting Control Group (REL + COG). T3 in the COG group reflects the follow-up measure, whereas t3 in the REL + COG reflects effect of the combined relaxation and cognitive training.

