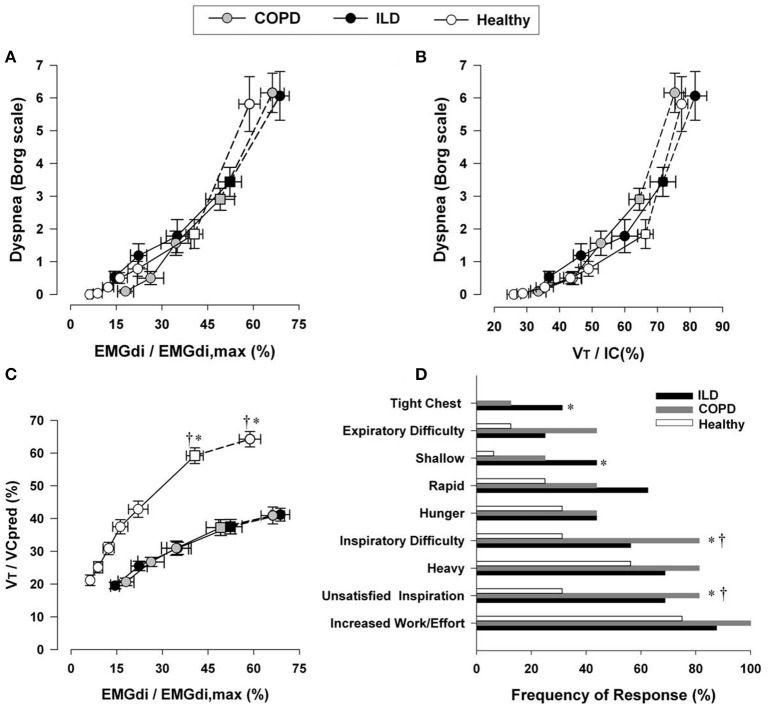
Figure 7.
Relation between dyspnea intensity (Borg units) and diaphragm electromyography (EMGdi) (A) and VT/IC (B) during incremental cycle exercise test in patients with moderate COPD, ILD and age-matched healthy controls. (C) Shows the relation between VT/VC and EMGdi/EMGdi,max (an index of inspiratory neural drive to the crural diaphragm); note the similar blunted VT/VC response to the increased neural drive in both ILD and COPD patients compared with healthy subjects. Values are mean ± SEM. Square symbols represent tidal volume-ventilation inflection points. Selection frequency of descriptors of exertional dyspnea at end-exercise in the three groups is shown in (D). *p < 0.05 for ILD vs. control subjects and †p < 0.05 for COPD vs. control subjects. COPD, chronic obstructive pulmonary disease; IC, inspiratory capacity; VT, tidal volume; VC, vital capacity; ILD, interstitial lung disease. Reproduced from with permission from the publisher (Faisal et al., 2016).

