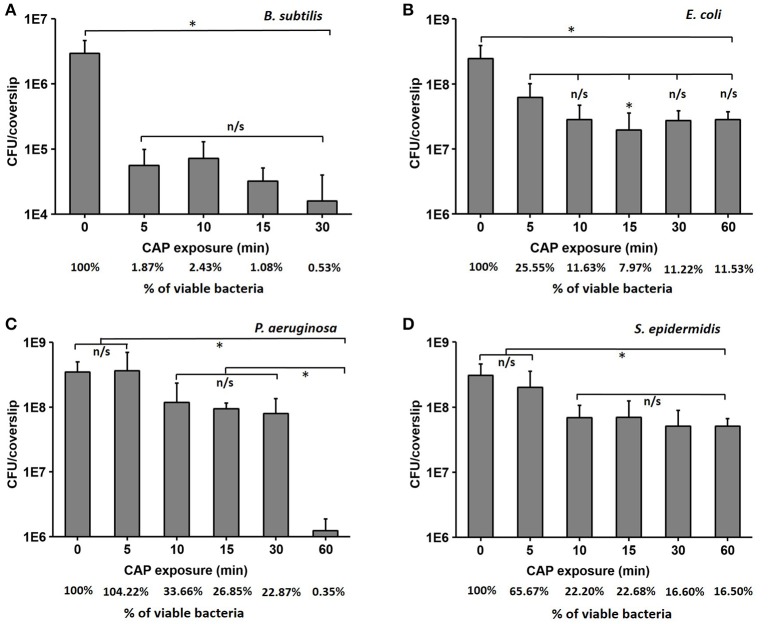
Figure 1.
The loss of viability (log scale) for B. subtilis (A), E. coli (B), P. aeruginosa (C), and S. epidermidis (D) after cold atmospheric plasma (CAP) exposure times of 5, 10, 15, 30, and 60 min compared to control samples. The % of viable bacteria was calculated by dividing the total number of bacteria counted in treated sample with total number of bacteria counted in control. All experiments were performed in biological triplicates, the data represent the mean values ± standard deviation. *P < 0.05, n/s is not significant.

