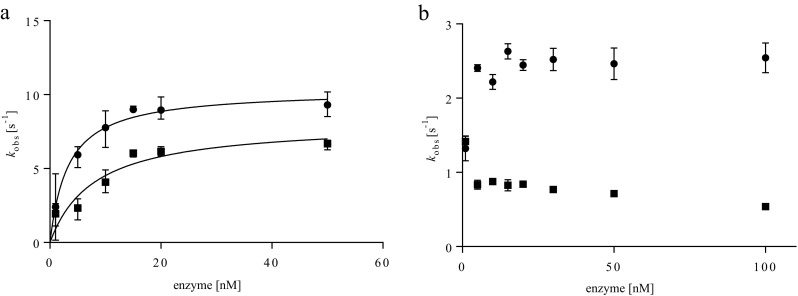
Fig. 2.

Enzyme concentration dependent activity of unfused P450BM3 (squares), unfused PTDH (squares), and PTDH-P450BM3 (circles). The graphs show the relation between enzyme concentration and the initial activities for a oxidation of 0.20 mM NADPH in the presence of 0.4 mM lauric acid as substrate at varying concentrations of either P450BM3 or PTDH-P450BM3 and b reduction of NADP+ in the presence of 2.0 mM phosphite as substrate at varying concentrations of either PTDH or PTDH-P450BM3. Concentrations of (PTDH)-P450BM3 were determined via CO-difference spectra, PTDH concentrations by Waddell’s method. Experiments were performed in triplicate
