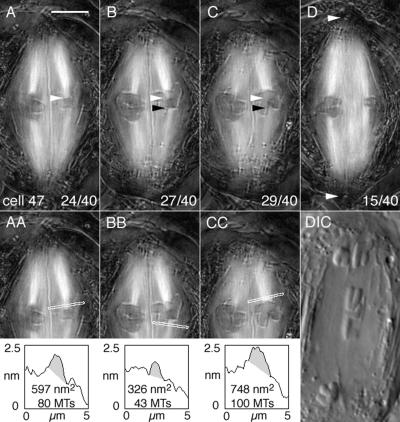
Figure 3.
Birefringent kinetochore fibers of a bivalent exhibiting amphisyntelic orientation during cold recovery. Cold treatment: 29 h at 0.2°C. (A–D) Four slices from the Z-series made through cell 47 at focus steps of 0.26 μm. Time elapsed after onset of cold recovery: 61 min. (A–C) Bivalent 2 is on the left; bivalent 3 is on the right. Bivalent 3 is maloriented. (D) Bivalent 1 is on the left; one of the sex univalents is on the right. Lower right: slice number/total slices in the Z-series. Bar, 5 μm. (A) White arrowhead locates one of the amphitelic kinetochores of bivalent 3 and its kinetochore fiber extends to the upper pole. (B) White arrowhead is positioned at the same X,Y pixel coordinates as in A; black arrowhead locates the other amphitelic sister kinetochore and its kinetochore fiber extends to the lower pole. (C) White and black arrowheads are positioned at the same X,Y coordinates as in A and B, respectively. In focus above the white arrowhead are the two syntelic sister kinetochores of the partner homologue and its kinetochore fiber extends to the upper pole. (D) White arrowheads locate the positions of the two basal bodies at the two spindle poles of cell 47. (AA) A duplicate image of A including the line from which retardance area data were obtained. The shaded area in the plot is the retardance area of the selected fiber. The inclination angle of the fiber was estimated to be 11° and retardance data were corrected accordingly. (BB) A duplicate of B with the plot of retardance area data obtained from it (inclination angle 13°). (CC) A duplicate of C with the plot of retardance area data obtained from it (inclination angle 17°). DIC: cell 47 during anaphase imaged with differential interference contrast microscopy showing the anaphase laggard that derived from the amphitelically oriented homolgue depicted in A and B. Time elapsed after initiation of cold recovery: 86 min.

