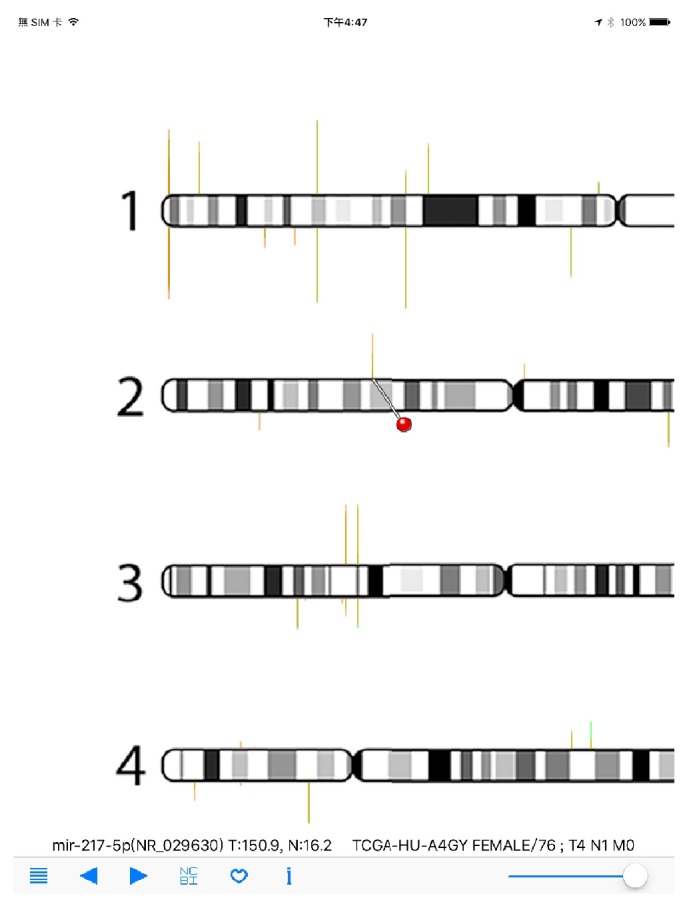
Figure 5.

RNA-Seq Viewer display for miRNA-Seq data (detailed view). Users can zoom into regions of interest for detailed miRNA expression comparison. A red-pin icon will appear when users click at any gene position. The left and right navigation buttons can be used to move the red-pin icon. Gene name (symbol) and RPM values are also displayed for interrogation. The mir-217-5p gene is displayed here.
