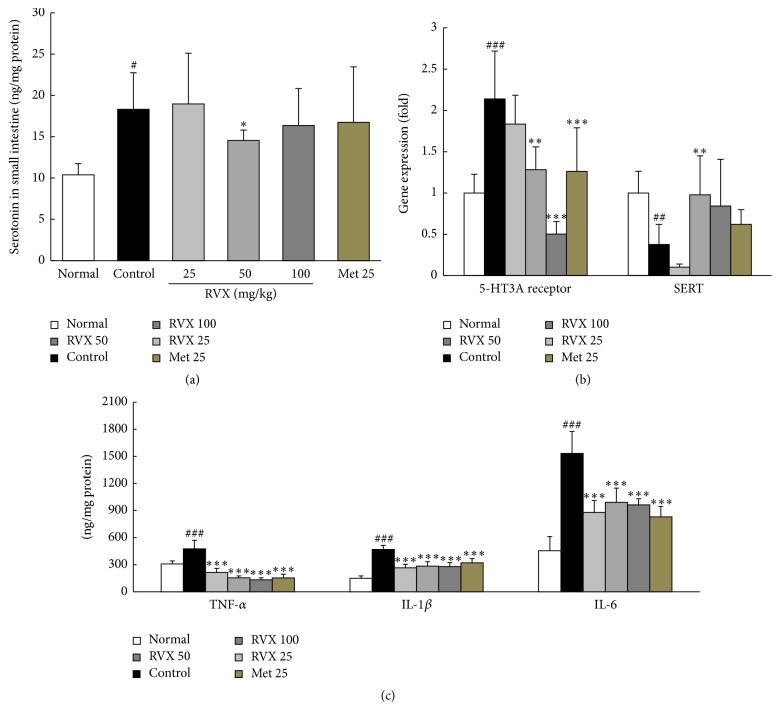
Figure 4.
Serotonin and its related genes and proinflammatory cytokines. Serotonin concentrations in the small intestine were measured using ELISA (a). The gene expression levels of 5-HT3A receptor and SERT were measured using real-time PCR (b). Protein levels of TNF-α, IL-6, and IL-1β (c) were performed using ELISA method. Data are expressed as the mean ± SD (n = 6). #P < 0.05, ##p < 0.01, and ###p < 0.001 compared with the normal group; ∗p < 0.05, ∗∗p < 0.01, and ∗∗∗p < 0.001 compared with the control group.

