Figure 3.

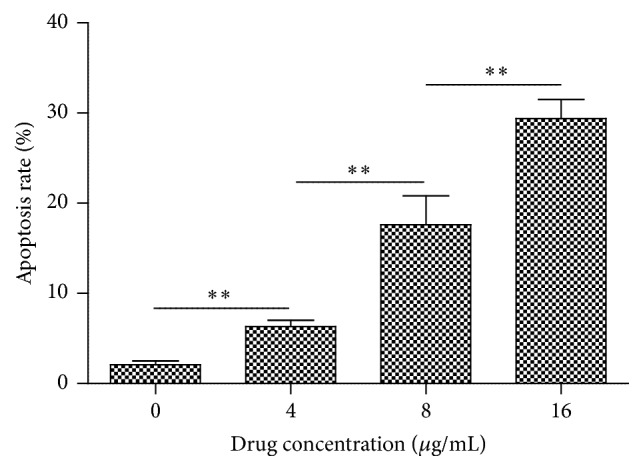
Quantitative analysis of apoptotic rate of cells exposed to different agents. Values are represented as mean ± SD (n = 3). ∗∗ means p < 0.01.

Quantitative analysis of apoptotic rate of cells exposed to different agents. Values are represented as mean ± SD (n = 3). ∗∗ means p < 0.01.