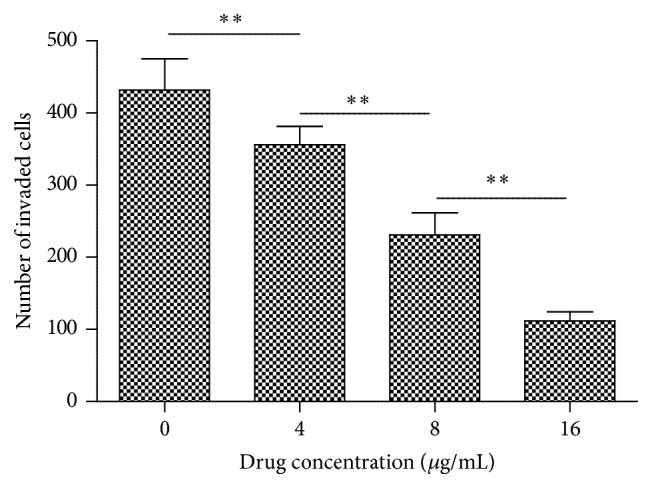
Figure 9.

Cell invasive ability of TPC-1 cells exposed to harmine. Quantification of the numbers of invaded cells exposed to a series of doses of harmine. Each data point represents the mean ± SD from three independent experiments. ∗ ∗ represents p < 0.01.
