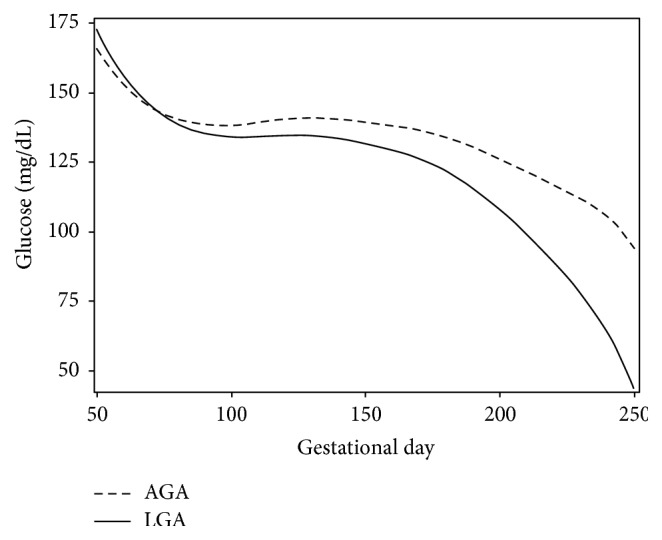
Figure 2.

Fitted glucose curves of women with type 1 diabetes based on semiparametric regression modeling using penalized regression splines to estimate the rate of change in glucose (y-axis, mg/dL) against gestation time (x-axis, in days). The solid line represents fitted maternal glycemic profiles of mothers who gave birth to LGA infants; the dashed line represents fitted maternal glycemic profiles of mothers who gave birth to AGA infants.
