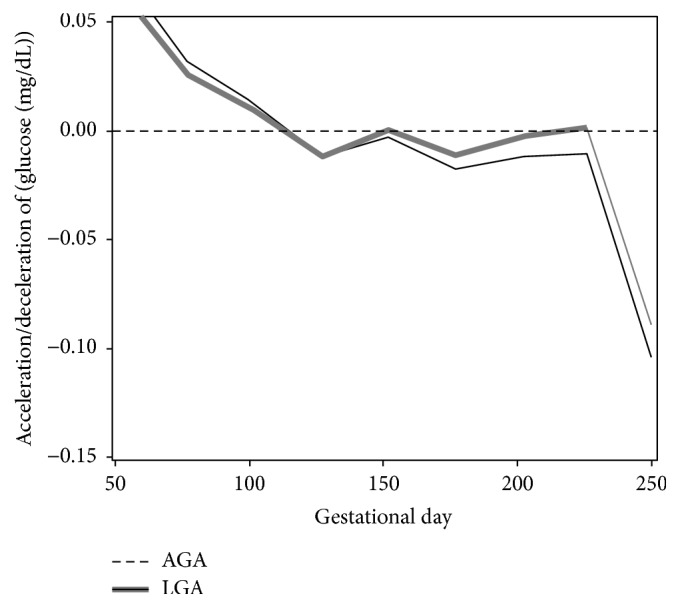
Figure 4.

Patterns of acceleration and deceleration in glucose according to LGA (solid line) and AGA (dashed line) birth outcomes. Rates of change in glucose for each group were calculated based on the second derivative (y-axis, mg/dL/day2) against gestation time (x-axis, in days). Portions of each curve that are above zero imply acceleration, while portions of each curve that are below zero mark deceleration. The overlapping regions in the 95% pointwise confidence intervals indicate periods in which glycemic levels for both groups had similar acceleration or deceleration. (It should be noted that women delivering LGA infants had increased acceleration early in pregnancy and increased deceleration later in pregnancy compared with women delivering AGA infants.)
