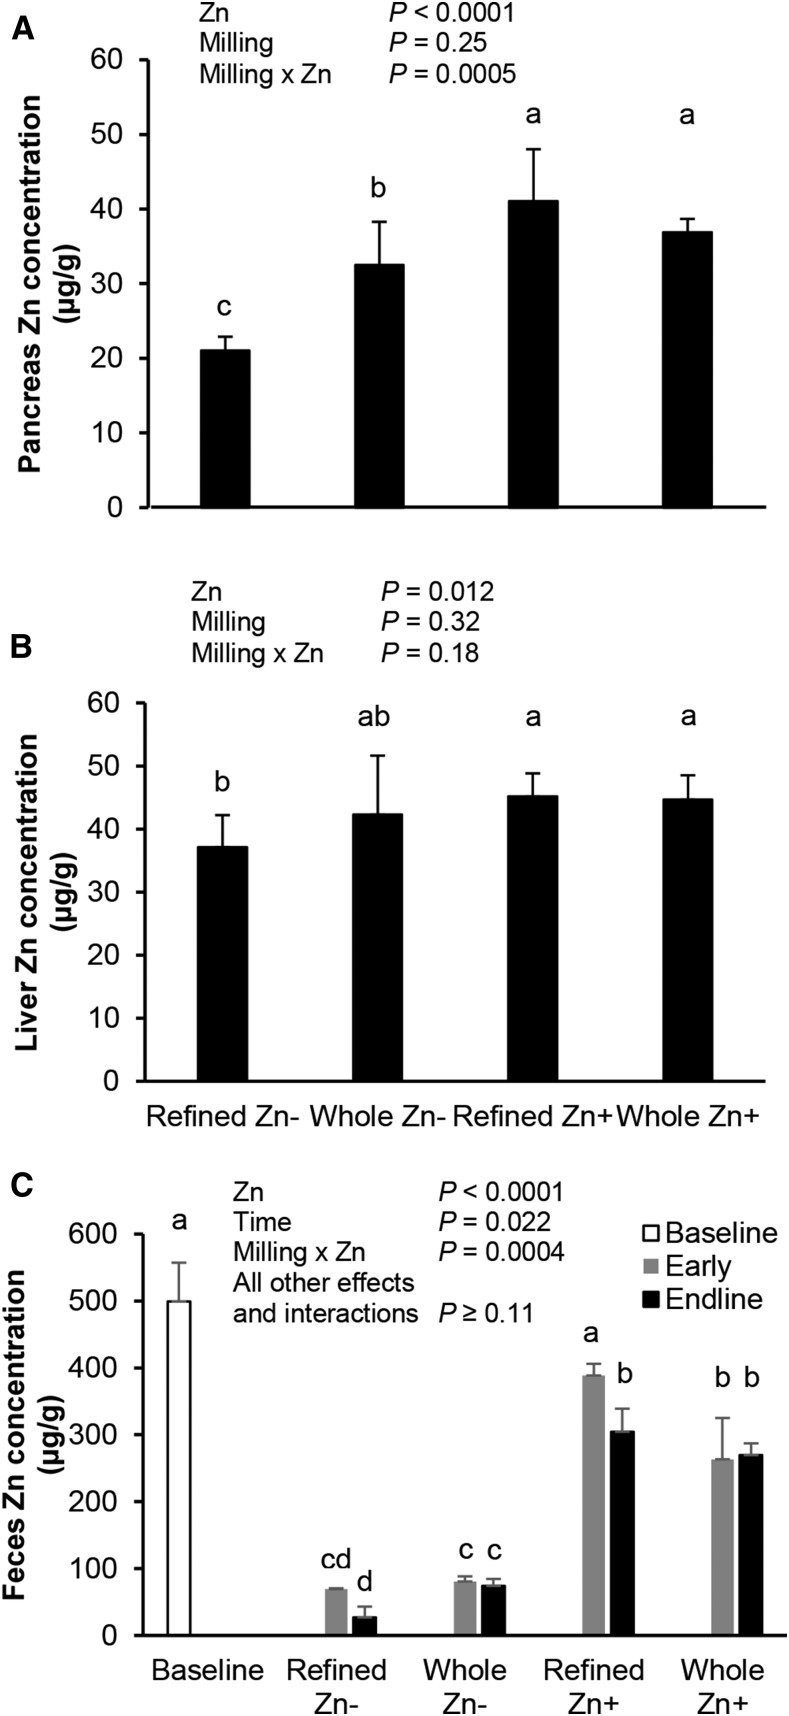
FIGURE 4.
Pancreatic zinc (A), liver (B), and fecal (C) zinc concentrations in male gerbils fed maize with different milling and supplemental zinc treatments (study 2). All liver zinc groups included 8 gerbils except the refined Zn− group (n = 9) at final measurements, and all fecal zinc groups included 8 gerbils except the whole Zn− group (n = 7) at final measurements. Fecal zinc concentration was pooled from the feces of gerbils from each treatment group (n = 3/group) at baseline (day 0), early (day 2–3), or endline (day 35) time points. All values are means ± SDs. Data were analyzed with the use of 2-factor (for the pancreas and liver) and 3-factor (for feces to include time) ANOVAs, including all interactions. Treatment groups with uncommon letters are significantly different: a > b > c > d. P < 0.05 was considered significant.

