
FIGURE 3.
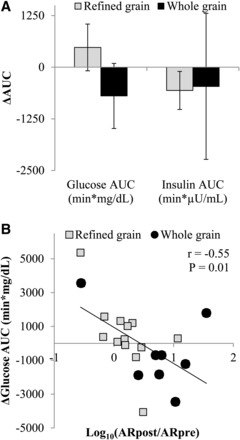
Mean ± SEM changes in the glucose AUC (P = 0.10) and insulin AUC (P = 0.54) that were measured during an oral-glucose-tolerance test that was administered before and after the consumption of a refined grain–based diet (n = 13) or a whole grain–rich diet (n = 8) for 6 wk (A). Change scores were compared with the use of an ANCOVA with the preintervention value, age, BMI, sex, and the weight change during the 6-wk intervention entered as covariates. (B) Changes in total plasma alkylresorcinol concentrations were correlated with changes in glucose AUC (Pearson correlation). Data are presented with outliers included. The exclusion of outliers did not change the significance of any test. ARpost, alkylresorcinol measured after intervention; ARpre, alkylresorcinol measured before intervention.