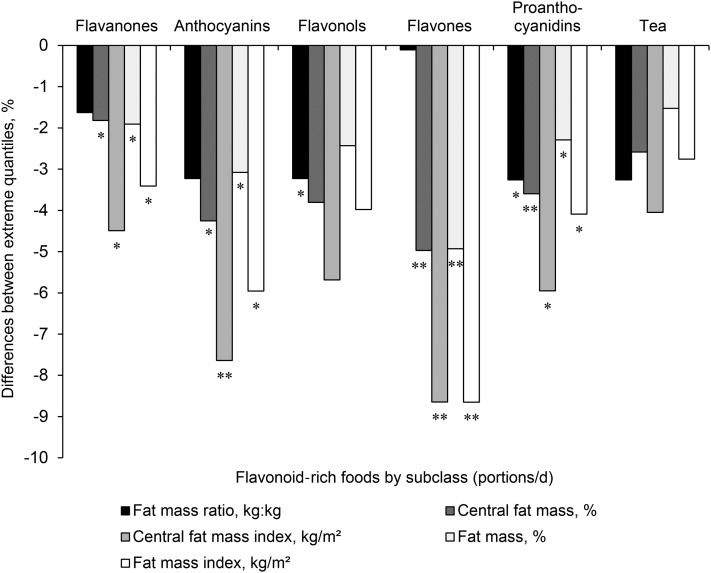
FIGURE 1.
Percentage differences in fat mass and fat mass distribution between extreme quantiles of intake of flavonoid-rich foods in 2734 women aged 18–83 y. Bars represent percentage differences in outcome measures between extreme quantiles of intake (portions per day). Quantile limits were selected on the basis of the best data distribution. Flavanone-rich foods (quintiles) were oranges (120 g), grapefruit (80 g), and fruit juice (160 g); anthocyanin-rich foods (quintiles) were berries (100 g), pears (170 g), grapes (80 g), and wine (125 mL); flavonol-rich foods (quintiles) were pears (170 g), tea (260 mL), and onions (60 g); flavone-rich foods (quintiles) were wine (125 mL), oranges (120 g), and peppers (80 g); and proanthocyanidin-rich foods (tertiles) were apples (100 g) and a cocoa beverage with milk (260 mL). Tea (260 mL) was the only food that contributed ≥10% to intakes of total flavonoids, flavan-3-ols, and polymers and was included individually in the figure (quartiles). *,**P values were calculated with the use of an ANCOVA with age, smoking, physical activity, menopausal status, hormone replacement therapy use, vitamin-supplement use, alcohol use, and intakes of energy, caffeine, saturated fat, polyunsaturated fat, monounsaturated fat, whole grains, and sugar-sweetened beverages as covariates: *P < 0.05, **P < 0.01.

