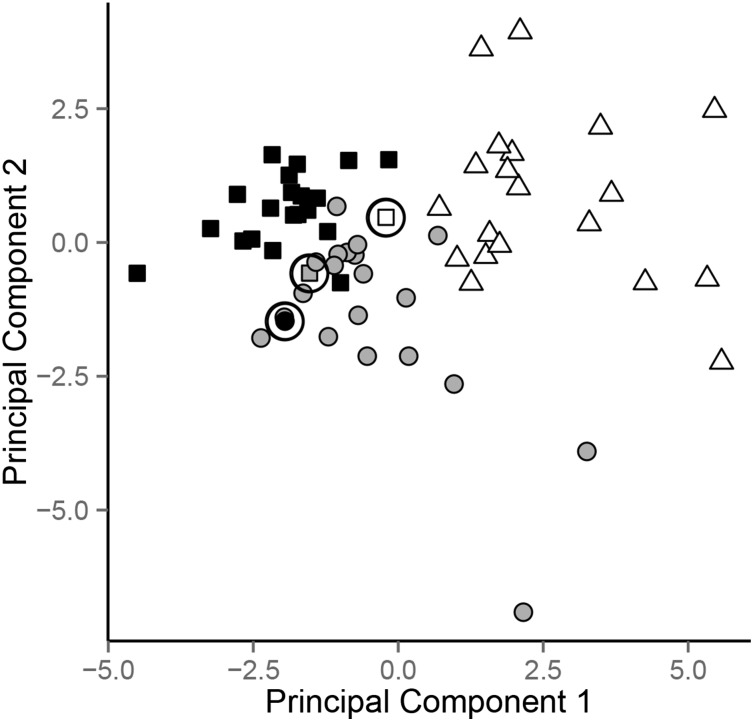
FIGURE 2.
Accuracy of diet classification according to metabolite profile. For each sample, the data from that sample was withheld, and a Bayesian network classifier was constructed from the metabolite profile data among the remaining samples. Then, the classifier was used to predict which diet had been consumed when the withheld sample was obtained. Samples are plotted based on their position relative to the 2 principal components that capture the most variation in the metabolite profiling data for each classifier. Colors indicate the actual diet corresponding to each sample (LF, black; LGI, gray; VLC, white), and shapes indicate the classifier prediction by the classifier (LF, square; LGI, round; VLC, triangle). Misclassified samples are circled. LF, low-fat diet; LGI, low–glycemic index diet; VLC, very–low carbohydrate diet.

