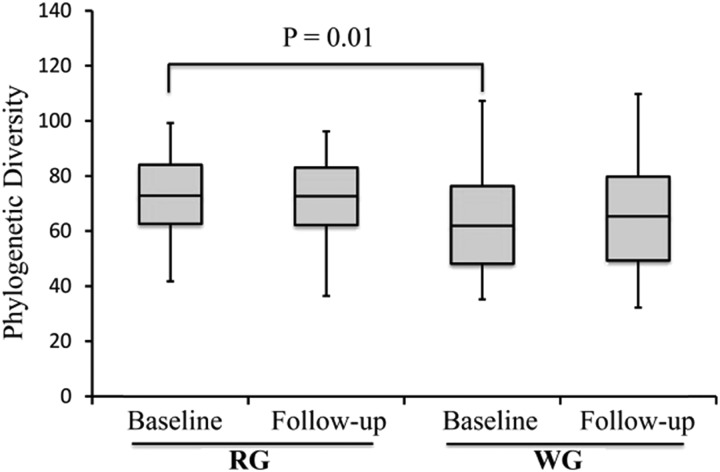
FIGURE 3.
α-Diversity comparisons of gut microbiota in stool samples that were collected at baseline and at the end of the intervention. Data are presented as box-and-whisker plots that show the distribution of data in quartiles. α Diversity did not significantly change from baseline after the intervention in either diet group as observed with the use of phylogenic diversity–richness metrics. The α diversity in stool samples that were collected at baseline was lower in the WG group (n = 38) than in the RG group (n = 39) (P = 0.01). RG, refined grain; WG, whole grain.

