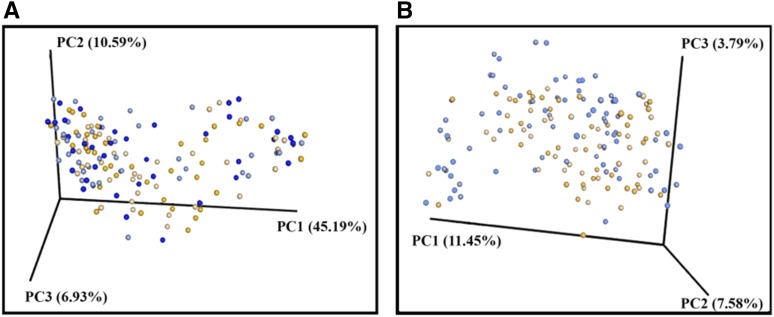
FIGURE 4.
β-Diversity comparisons of gut microbiota in stool samples that were collected at baseline and after the intervention. Data are shown from WG participants (n = 38) before the intervention (dark-blue dots) and after the intervention (light-blue dots) as well as from RG participants (n = 39) before the intervention (dark-orange dots) and after the intervention (light-orange dots). A PC analysis of weighted (A) and unweighted (B) UniFrac distances. A permutation-based ANOVA [Adonis function in the vegan package in R software (60); 99 permutations] with weighted UniFrac-distance metrics revealed that the variation in the gut microbiota community structure could not be explained by the intervention group either at baseline (P = 0.39) or after the intervention (P = 0.25). However, a similar analysis with the use of unweighted UniFrac metrics showed differences in the microbiota structure of WG and RG groups at P = 0.05 and P = 0.07 for baseline and after the intervention, respectively. PC, principal coordinate; RG, refined grain; WG, whole grain.

