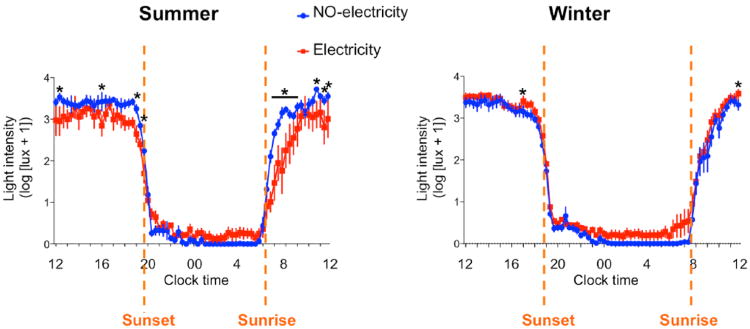
Figure 2.
Light-exposure profiles in Toba communities living without access to electricity (NO-electricity) and with free access to electricity (Electricity). Mean waveforms for the 2 communities during the summer and winter are shown. *Significant difference between groups (p < 0.05), post hoc comparisons, Fisher's least significant difference test. Data represent mean ± SEM.

