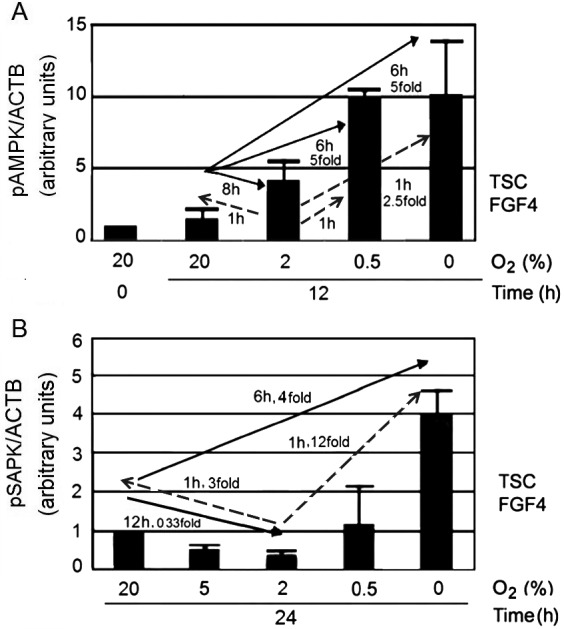
Fig. 4.

O2 stresses induced an S-shaped curve for pAMPK levels, and a U-shaped curve for pSAPK levels, but activation of both enzymes was most rapid when O2 was changed from the least stressful condition at 2% O2. A) Summary of the pAMPK dose and kinetic responses to changes in O2 levels, based on the data presented in Figs. 1–3. The tail of the arrow is the O2 level at time zero before the change in O2 conditions, and the head of the arrow is the level of O2 into which the cells were moved. mTSCs responded to culture at 20%, 2%, 0.5%, and 0% O2 with an S-shaped pAMPK dose-response curve, with a maximal increase of ~10-fold over baseline after 12 h of culture. B) Summary of the SAPK dose and kinetic responses to changes in O2 levels, based on a published figure we cite with permission [11]. The tail of the arrow is the O2 level at time zero before the change in O2 conditions, and the head of the arrow is the level of O2 into which the cells were moved. pSAPK levels were lowest at 2% O2 and increased rapidly within 1 h, when the cells were removed from 2% O2. The change from 20% to 0% O2 produced a slower activation of SAPK.
