Table 2.
Promoter binding and enriched cis-regulatory motifs
| Promoter bindingb | Enriched motifsc | |||||||
|---|---|---|---|---|---|---|---|---|
| Cell cycle subclustera | Fkh1 | Fkh2 | Mcm1 | Ndd1 | Swi5 | Ace2 | (Name, #/total, P-value) | Genes with motifd |
| G2/M (13) |
SUR7 YOR315W CLB2 |
SUR7 YOR315W ALK1 SWI5 CLB2 |
SUR7 YOR315W ALK1 SWI5 CLB2 YNL058C |
SUR7 YOR315W ALK1 SWI5 CLB2 YNL058C IQG1 CHS2 |
SUR7 YOR315W |
 |
SUR7 BUD3 YOR315W ALK1 HST3 SWI5 CLB1 CLB2 YNL057W IQG1 CHS2 SRC1 (but not YNL058C) |
|
 |
SUR7 HST3 CLB2 YNL058C YNL057W IQG1 CHS2 SRC1 |
|||||||
 |
ALK1 HST3 SWI5 CLB2 YNL058C CHS2 SRC1 |
|||||||
| M/G1 18 |
AMN1 | AMN1 | PIR3 PIR1 |
SIC1 YLR194C ASH1 AMN1 JIP1 TEC1 YPL158C PCL9 EGT2 PST1 PIR3 PIR1 HSP150 |
AMN1 NIS1 TEC1 DSE4 EGT2 HSP150 |
 |
SIC1 YNL046W CYK3 YLR194C ASH1 AMN1 NIS1 TEC1 DSE4 YPL158C PCL9 DSE3 EGT2 PST1 PIR3 PIR1 HSP150 GPA1 |
|
| G1 (8) | DSE2 CTS1 |
GIC2 DSE2 DSE1 CTS1 |
SCW11 CTS1 | DSE2 DSE1 SCW11 CTS1 |
 |
YJL217W GIC2 SHQ1 DSE2 DSE1 SCW11 CTS1 RME1 |
||
 |
YJL217W GIC2 SHQ1 DSE2 DSE1 SCW11 RME1 |
|||||||
Subclusters are designated by the cell cycle phase in which their expression normally peaks. Number of genes in each subcluster is shown in parentheses
Promoter binding by transcription factors, shown below (based on promoter localization data; Simon et al., 2001). Genes shown are those for which binding by the designated transcription factor was considered statistically significant (p < 0.002)
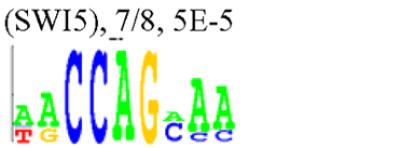
Motif logos. Shown are those that were shared and enriched in promoters of the clustered genes. Novel motifs are designated with the respective subcluster name; known motifs are designated with TRANSFAC identifiers. Motif name is followed by the number of genes with motif out of the total number of genes in the subcluster, and the p value describing the significance of motif enrichment in the subcluster compared with the entire cell cycle phase cluster
Genes containing the presented motifs in their promoter
