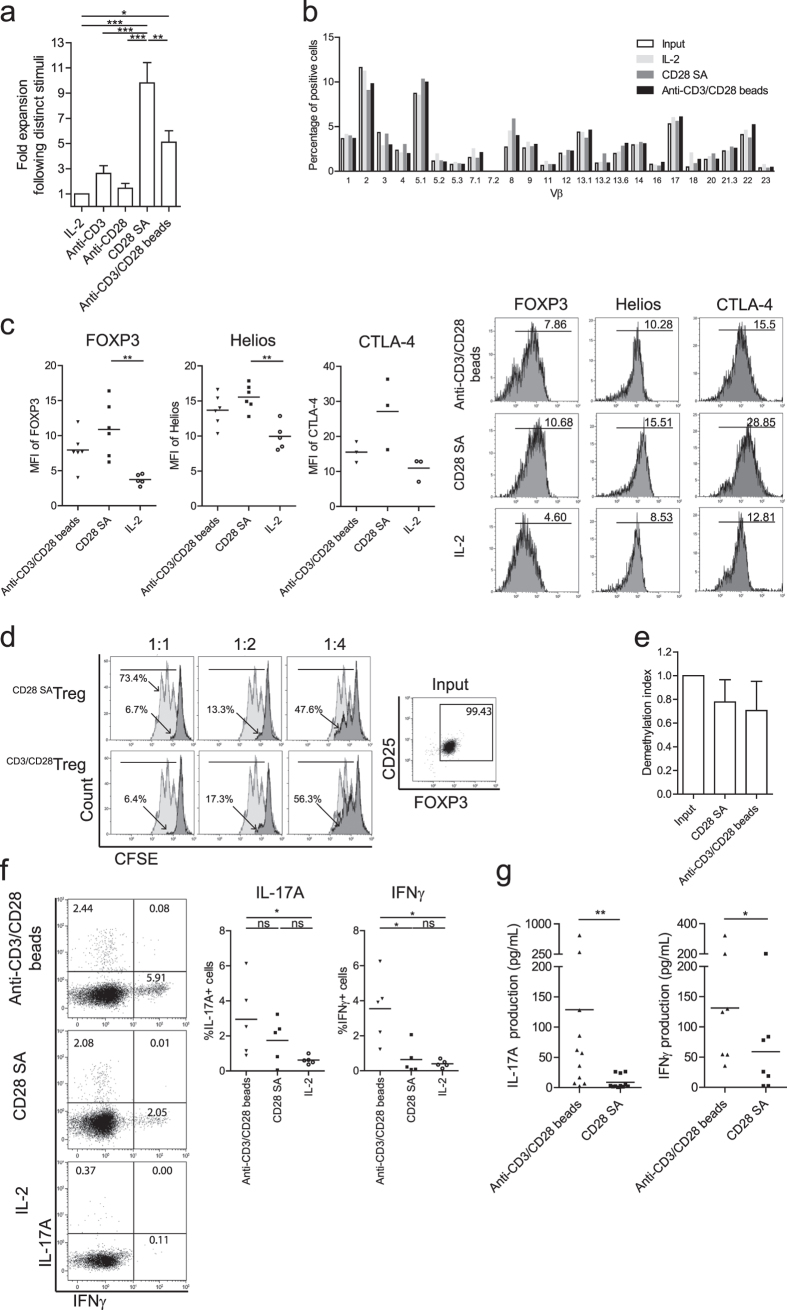
Figure 3. CD28-superagonist drives polyclonal Treg proliferation and enhances expression of FOXP3, Helios and CTLA-4.
Flow cytometry of FACS-sorted human Treg that were stimulated with soluble CD28-superagonist(CD28 SA) or anti-CD3/CD28 mAb coated microbeads (anti-CD3/CD28 beads) in the presence of rhIL-2. As a control Treg cultured in the presence of rhIL-2 only were included. (a) Fold expansion of Treg during 7 days of culture. n = 6–9. (b) TcR Vβ repertoire analysis following the indicated stimuli (see legend). One experiment of two similar ones conducted with cells obtained from different donors is shown. (c) Intracellular expression of FOXP3, Helios and CTLA-4 by Treg after 7 days stimulation (X-axis). Numbers within the histogram show the median fluorescence intensity (MFI). n = 6. (d) CFSE-based co-culture suppression assays showing a representative experiment of two independent ones. The ratio of Treg:Tresp are indicated at the top. Numbers indicate the percentage of divided responder T cells. Grey line: stimulated Tresp; Black line: co-cultured with CD28-superagonist or anti-CD3/CD28 beads expanded Treg. (e) Demethylation status of FOXP3 gene was analyzed using bisulfate sequencing. n = 3. (f) Intracellular staining of IL-17A and IFNγ at day 7 of the cultures. Numbers within the quadrant indicate the percentage of positive cells. Dot plots show a representative experiment of five individual ones conducted with cells obtained from different donors as shown in the cumulative data graphs; n = 5. (g) Measurement of IL-17A and IFNγ production in culture supernatants using luminex at day 7 of the cultures. n = 11 (for IL-17A) and n = 7 (for IFNγ). Bar in cumulative data indicated the mean value. Kruskal-Wallis followed by Dunns post-hoc test was used for statistical analysis (a,c,e–g). *P < 0.05; **P < 0.01; ns: not significant.

