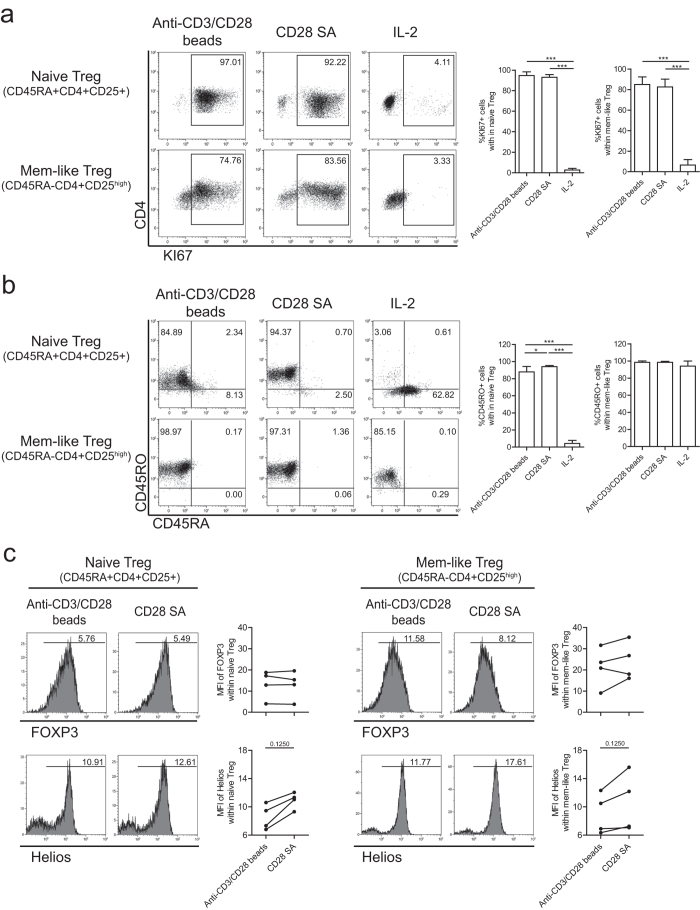
Figure 4. CD28-superagonist stimulation drives both naïve and memory Treg proliferation.
Flow cytometry of FACS-sorted human naïve (CD4+CD45RA+CD25+) and memory (CD4+CD45RA-CD25high) Treg that were stimulated with CD28-superagonist(CD28 SA) or anti-CD3/CD28 mAb coated-microbeads in the presence of rhIL-2. As a control Treg cultured in the presence of rhIL-2 only were included. Dotplots show intracellular staining of KI67 (a), isoform switch of CD45RA and CD45RO (b), and intracellular expression of FOXP3 and Helios (c). Numbers within (a) and (b) indicate the percentage of positive cells, and numbers within the histogram (c) indicate the MFI values. A representative example of n = 4 individual experiments conducted with cells obtained from different donors is shown. Aggregate data are shown in the figures at right side of the flow cytometry plots. Kruskal-Wallis followed by Dunns post-hoc test (a,b) and Wilcoxon signed-rank test (c) were used for statistical analysis. *P < 0.05; ***P < 0.001.

