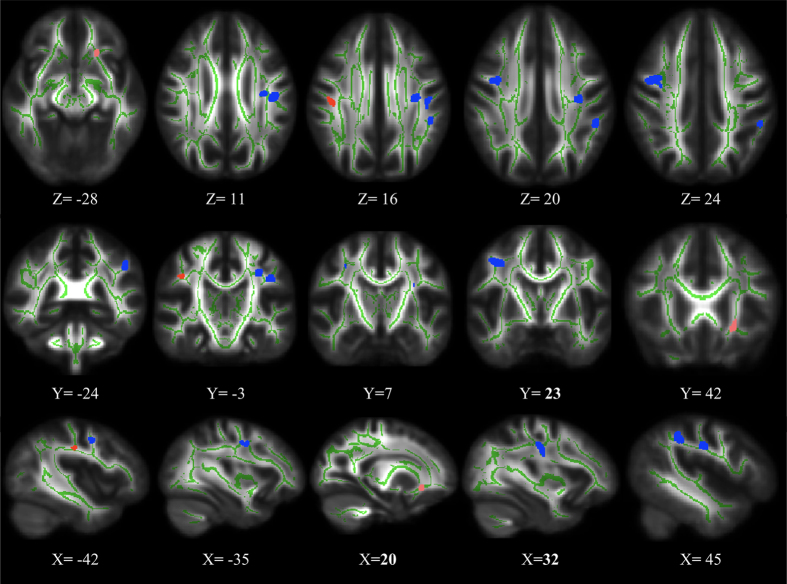
Figure 4. Overlapping WM areas between DTI measures (FA, AD and RD) in ASPD patients relative to controls (FDR corrected, p < 0.05).
Blue represents decreased FA and AD value in ASPD patients, red represents decreased FA and increased RD value in ASPD patients, and pink represents increased FA and RD value in ASPD patients.

