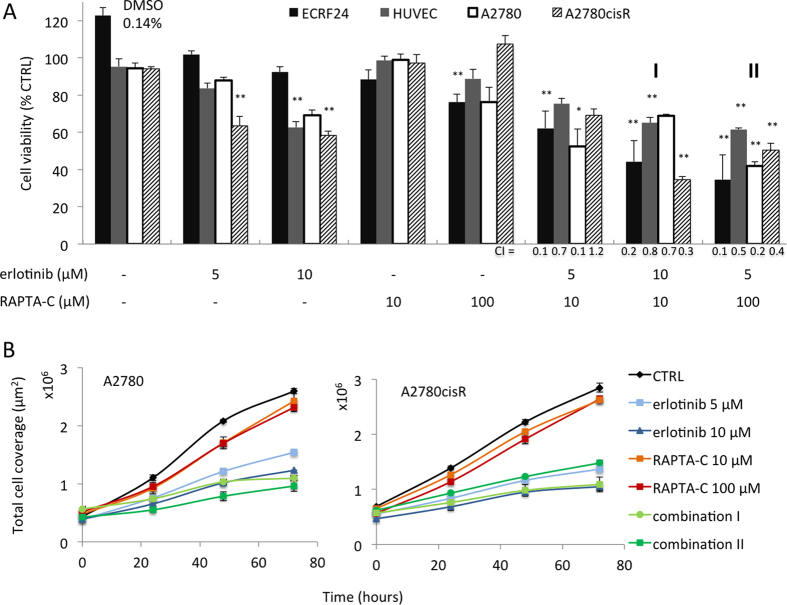
Figure 1.
Activity of erlotinib and RAPTA-C on endothelial and ovarian cancer cell viability (A) and on total cell coverage per μm2 surface (B). (A) Inhibition of cell viability by erlotinib, RAPTA-C and their combinations in endothelial cells (immortalized ECRF24 and primary human umbilical vein endothelial cells; HUVEC) and ovarian cancer cells (A2780 and A2780cisR). The combination of erlotinib 5 μM/RAPTA-C 10 μM, erlotinib 10 μM/RAPTA-C 10 μM (marked as I) and erlotinib 5 μM/RAPTA-C 100 μM (marked as II) are shown. Cell viability was assessed after 72 h of drug treatment by the CellTiter-Glo luminescence assay and represented as a percentage of the control. Combination index (CI) values per cell line for erlotinib/RAPTA-C combinations are shown. Significance is indicated vs. CTRL (0.14% DMSO-treated cells), with *P < 0.05 and **P < 0.01, based on a one-way ANOVA with post-hoc Tukey’s test (ECRF24: F(19, 219) = 13.69, P < 0.0001; HUVEC: F(19, 175) = 16.83, P < 0.0001; A2780: F(19, 85) = 10.86, P < 0.0001; A2780cisR: F(19, 205) = 58.2, P < 0.0001). (B) Total cell coverage of A2780 and A2780cisR cells attached to the bottom of a 96-well plate. Total cell coverage was assessed at 0, 24, 48 and 72 hours of drug treatment and automatically measured and quantified. Values shown represent absolute values of the total surface in μm2 occupied by cells. Values represent the mean of at least one experiment performed in triplicate and error bars represent the SEM.

