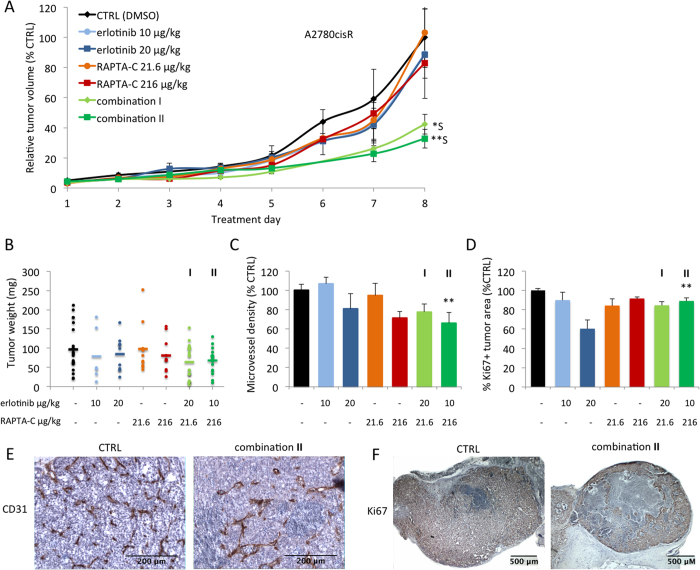
Figure 6. Inhibition of A2780cisR tumor growth in the CAM model by erlotinib, RAPTA-C and their combination treatment.
(A) Tumor growth curves of A2780cisR tumors grafted on the CAM showing tumor volume with respect to treatment day, represented as the percentage of the final control tumor volume. S indicates synergy. N = 20 in the control group and N = 7–15 in the treatment groups. Control tumors were treated with 0.14% DMSO in NaCl (two-way ANOVA: F(6,550) = 4.692, P = 0.0001). (B) Tumor weight (mg) after resection at treatment day 8 (when the experiment was terminated; not significant, one-way ANOVA: F(2,54) = 3.05, P = 0.055). (C) Microvessel density (MVD) analysis measured as the number of vessels per mm2 of vascularized tumor area and represented as percentage of control (one-way ANOVA: F(2,31) = 5.641, P = 0.0081). (D) Quantification of the percentage of whole tumor surfaces that are positive for the proliferation marker Ki67 (one-way ANOVA: F(2,34) = 4.67, P = 0.016). (E) Representative images of IHC staining for the endothelial cell marker CD31 (brown) counter-stained with haematoxylin (purple/blue). (F) Representative images of IHC staining for the proliferation marker Ki67 (brown/orange) counter-stained with haematoxylin (purple/blue). I indicates the combination erlotinib 20 μg/kg/day + RAPTA-C 21.6 μg/kg/day and II indicates the combination 10 μg/kg/day + RAPTA-C 216 μg/kg/day in all graphs. Error bars represent SEM and *P < 0.05, **P < 0.01 indicate significance versus CTRL. Statistical analysis was performed using a two-way ANOVA with post-hoc Tukey’s multiple comparison test (A), or one-way ANOVA with post-hoc Dunnett’s multiple comparison test between the combination and control (B–D).

