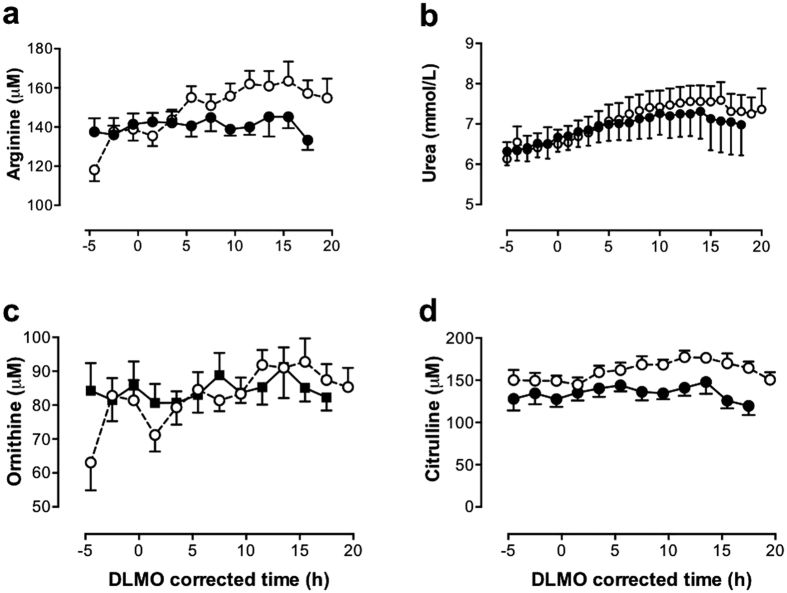
Figure 2. Twenty four-hour profiles of urea cycle metabolites.
(a) Arginine, (b) urea, (c) ornithine, (d) citrulline. Mean (±SEM) plasma levels in control (◾, solid line) and transgenic HD (○, dashed line) sheep are presented, corrected for circadian phase using each sheep’s dim light melatonin onset (DLMO), annotated as zero (=20.9 ± 0.9 h (mean ± SEM) ≈21.00 h). Significantly increased arginine, urea and citrulline concentrations were observed in the HD sheep compared to the controls (FDR < 0.05).

