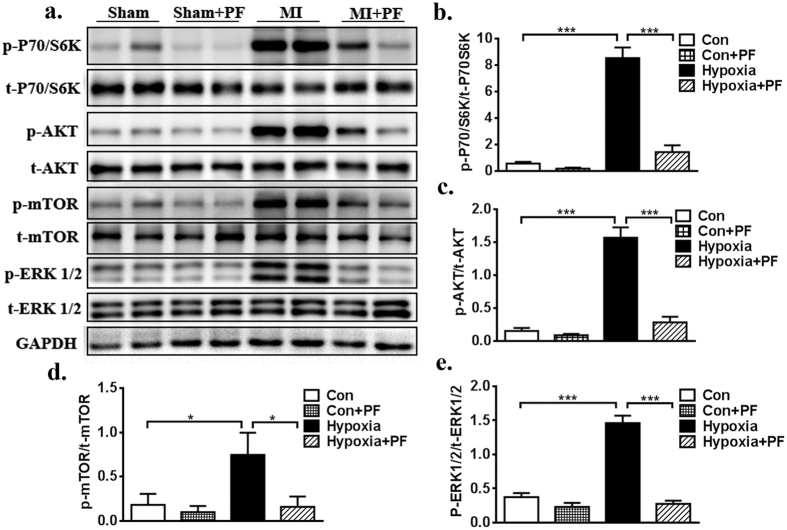
Figure 5. Inhibition of FAK restores downstream signaling.
(a) Expressions of FAK-related signaling pathway including p-mTOR, p-AKT (S473), p-P70S6K, p-ERK1/2 and t-mTOR, t-AKT (S473), t-P70S6K, t-ERK1/2 in different groups (two individual samples were loaded in each group) were tested by Western Blot. (b–e) Densitometric analysis of blots from panel a. Multiple exposures of blots are presented in Supplementary Figure S6; full-length blots are presented in Supplementary Figure S5. Data are presented as means ± SEM. *P < 0.05, **P < 0.01, ***P < 0.001.

