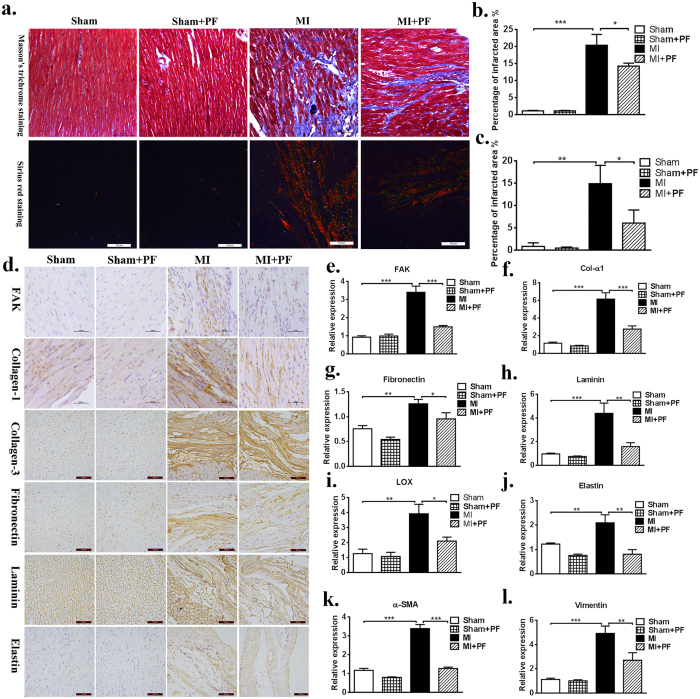
Figure 6. Targeted inhibition of FAK attenuates cardiac fibrosis.
(a) Masson’s trichrome staining: in the sham group, nearly no area was stained blue. Sirius red staining: type I collagen performed red to yellow, type III collagen performed green and normal tissue performed gray. More collagens could be seen in the MI group with infiltration to non-fibrotic tissues; MI with PF reduced the area of interstitial fibrosis. (b,c) Quantitative data showing the percentage of collagen-positive area from panel a. (d) Immunohistochemistry: with specific primary antibody of interest, increased expression of fibrosis level can be noted at the extracellular matrix in the MI group. (e–i) RT-PCR analysis shows that FAK inhibitor significantly decreased total ECM production, as well as FAK, α-SMA, vimentin in MI with PF group when compared to that in MI group. Bar = 100 μm. Data are presented as means ± SEM. *P < 0.05, **P < 0.01, ***P < 0.001.

