
Figure 9. Expression of genes implicated in synthesis of antioxidants and organic solutes in 12 alfalfa genotypes under saline and control treatments.
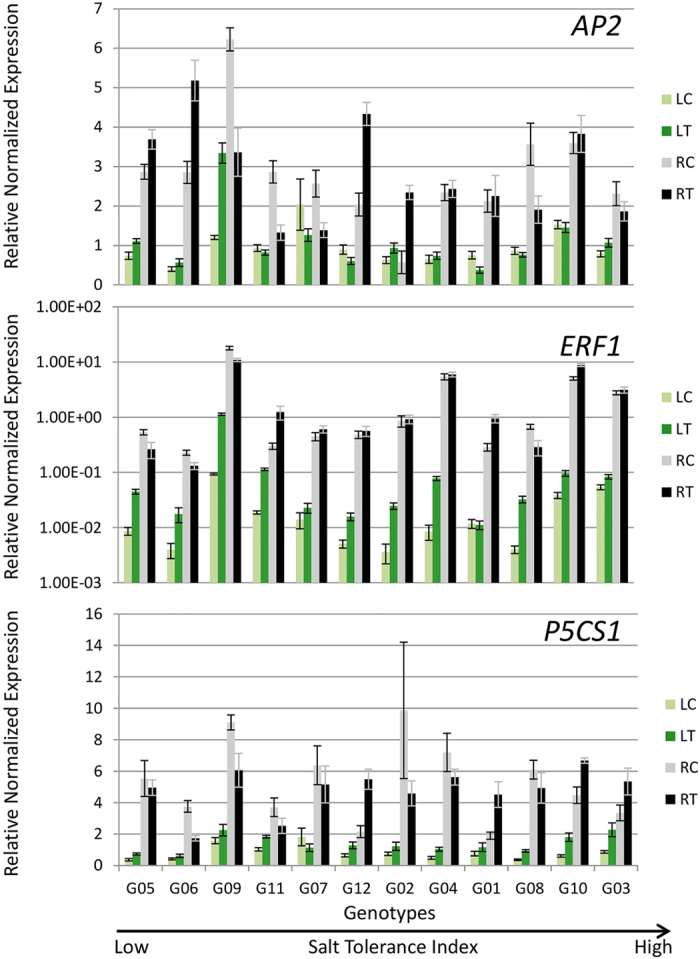
Genotypes are arranged on x-axis in ascending order based on their ST index. Due to large differences in the expression in leaves and roots in ERF1 bar diagram, Y-axis is presented in log scale. RC, Control Roots; RT, Treatment Roots; LC, Control Leaves; LT, Treatment Leaves. Error bars represent standard error.