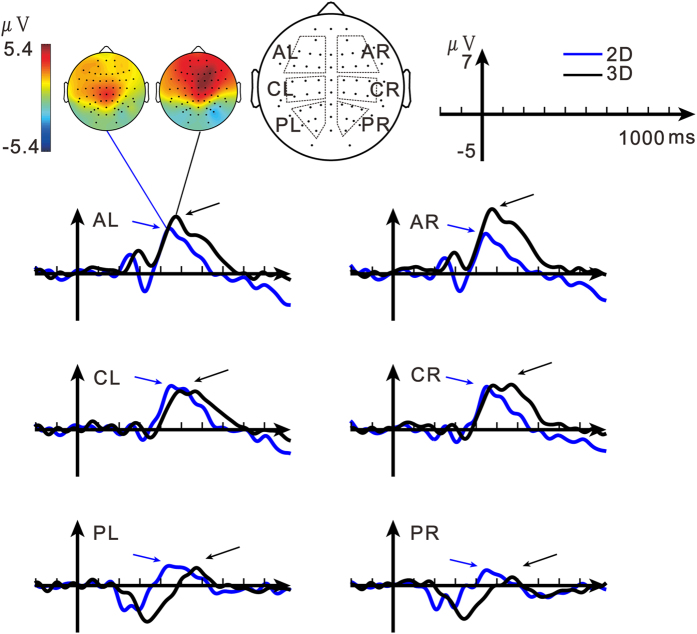
Figure 2. Illustration of the average differential waveforms (deviant vs. standard stimuli) in the 2D (blue) and 3D (black) conditions.
The DP3 signal is indicated by the arrow. The topographies of the DP3 signals are plotted above the waveforms. Data are clustered into 3 scalp regions (anterior (A), central (C), posterior (P)) in each hemisphere, as shown on the right of the topographies.

