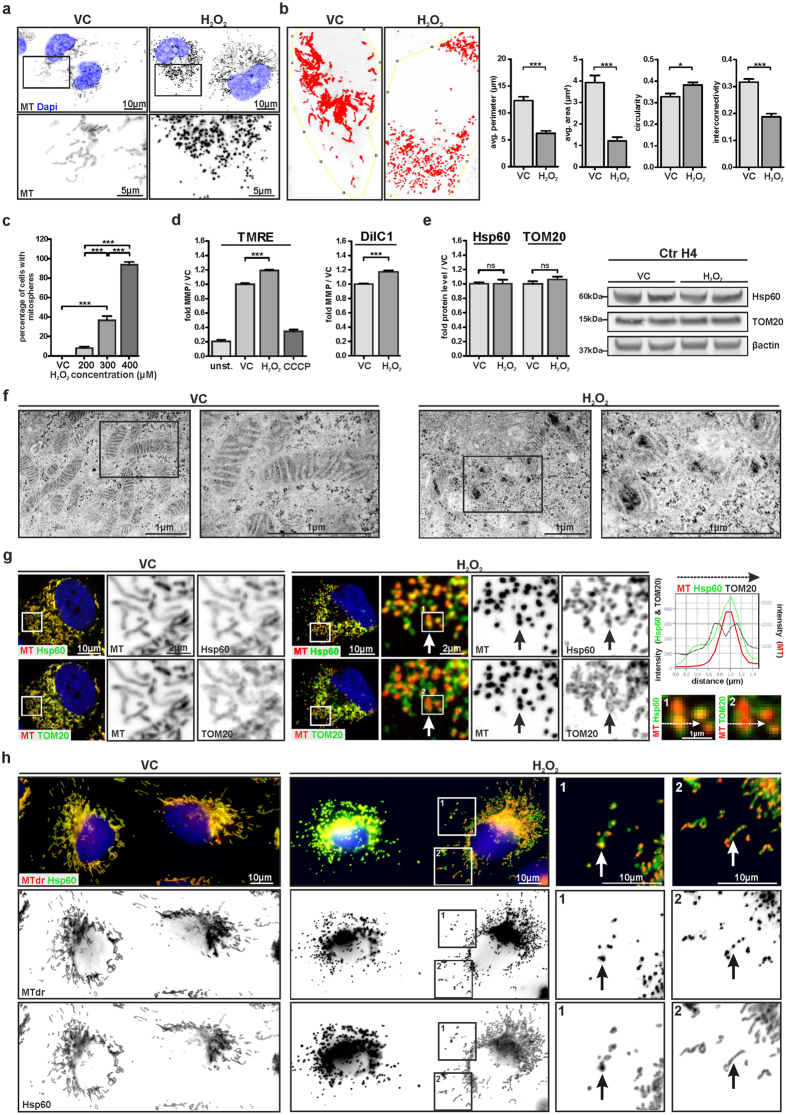
Figure 1. H2O2 induces the formation of mitospheres - spherically shaped and hyperpolarized mitochondria.
(a) Human H4 neuroglioma cells were treated with 300 μM H2O2 or vehicle control (VC) for 4 h and the mitochondrial network was stained by MT. (b) The assessment of the average (avg.) perimeter, average area, circularity and interconnectivity of mitochondria from cells under VC-conditions and cells showing mitospheres under OS is shown (n = 9 cells analyzed per condition from three independent experiments, unpaired two-tailed t-test, avg. perimeter: p < 0.0001; avg. area: p < 0.0001; circularity: p = 0.0116; interconnectivity: p < 0.0001). (c) The percentage of cells with mitospheres increased with rising concentrations of H2O2, as quantified 4 h after treatment (One-way ANOVA Tukey’s Multiple Comparison Test, n = 3 with >300 cells quantified per sample, p < 0.0001, F = 242.2). (d) TMRE or DilC1 staining measured via flow cytometry showed that H2O2 exposure (300 μM, 4 h) led to an increase in MMP. Mean cellular fluorescence intensity compared to VC-treated cells is illustrated. CCCP-treatment served as control. unst. = unstained control (TMRE: One-way ANOVA Tukey’s Multiple Comparison Test, n ≥ 5, p < 0.0001 (VC vs. H2O2), DilC1: unpaired two-tailed t-test, n = 3, p = 0.0008). (e) H2O2 treatment did not influence Hsp60 and TOM20 levels as quantified via Western blot (WB) (unpaired two-tailed t-tests, n = 6, p = 0.9801 (Hsp60), p = 0.2853 (TOM20). (f) Electron microscopic analysis revealed that - in contrast to the tubular mitochondria under VC - H2O2-treated H4 cells show round-shaped mitochondria with electron-dense inclusions. (g,h) Mitochondria were stained with MT or MTdr, as well as antibodies against Hsp60 and TOM20. (g) Enlargements (1 and 2) representing the regions (marked by crisscross arrows) of the intensity profiles illustrate the co-labeling of mitospheres with Hsp60, as well as that the TOM20 staining surrounds the mitospheres. (h) Enlargement of different regions of the mitochondrial network within one cell shows parts of the mitochondrial network in which both MT and Hsp60 display spherical mitochondrial structures (1), while in other parts only the MMP-dependent MT accumulated in precise spherical regions (2).

