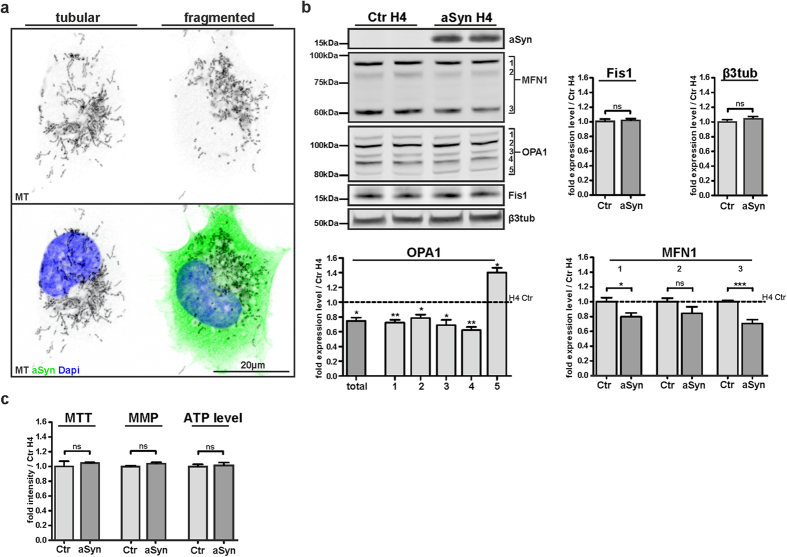
Figure 6. aSyn potentiates mitochondrial fragmentation under basal conditions.
(a) Immunocytochemical staining of aSyn (15G7) and mitochondria (MT) of mixed cultured aSyn and Ctr H4 cells shows more fragmented mitochondria in aSyn overexpressing cells. (b) Quantification of the protein levels of OPA1, MFN1 and Fis1, as well as β3-tubulin levels as controls, indicates an influence of aSyn overexpression on mitochondrial fusion proteins (unpaired two-tailed t-tests, OPA1: n = 5, p = 0.0114 (total), p = 0.0027 (1), p = 0.0158 (2), p = 0.0245 (3), p = 0.0015 (4), p = 0.0136 (5), MFN1: n = 10, p = 0.0155 (1), p = 0.1348 (2), p < 0.0001 (3), Fis1: n = 5, p = 0.7619, β3-tubulin: n = 10, p = 0.3295). (c) Measurement of cell viability via MTT assay (unpaired two-tailed t-test, n = 3, p = 0.5440), of MMP via DilC1 staining and flow cytometry (unpaired two-tailed t-test, n = 3, p = 0.1313), as well as of ATP levels (unpaired two-tailed t-test, n ≥ 4, p = 0.7604) showed no differences between aSyn and Ctr H4 cells.

