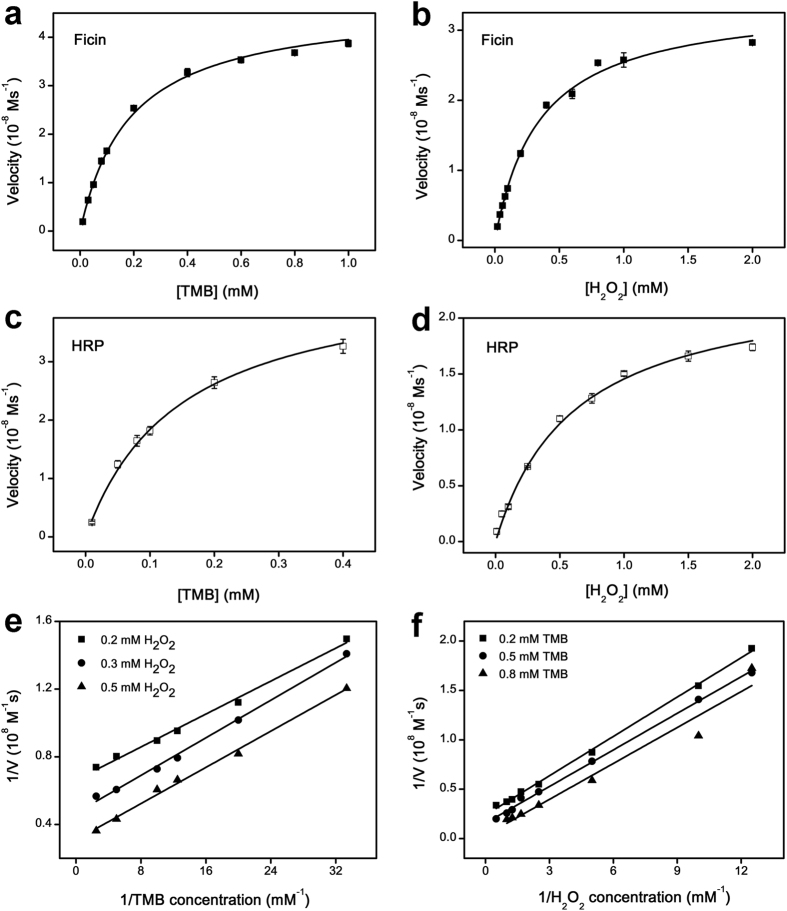
Figure 3. Steady-state Kinetic Assay and Catalytic Mechanism of Ficin.
(a–d) The velocity (v) of the reaction was measured using 1.0 μg mL−1 ficin (a,b) or 1.0 ng mL−1 HRP (c,d) under optimal conditions. Error bars represent the standard deviations of three independent experiments. (a,c) The concentration of H2O2 was 0.80 mM (ficin) or 1.0 mM (HRP) and varied concentration of TMB. (b,d) The concentration of TMB was 0.40 mM (ficin) or 0.60 mM (HRP) and varied concentration of H2O2. (e,f) Double-reciprocal plots of activity of ficin at a fixed concentration of one substrate versus varying concentration of the second substrate.

