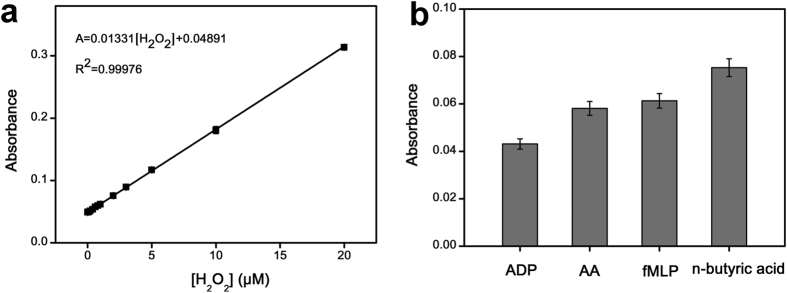
Figure 5. Ficin applied to detect the H2O2 release from MCF-7 cells.
(a) Linearity of absorbance against a H2O2 concentration range of 0–20 μM. (b) Comparison of fluxes of H2O2 release from cells induced by ADP (200 ng mL−1, 0.47 μM), AA (200 ng mL−1, 1.14 μM), fMLP (200 ng mL−1, 0.46 μM) and n-butyric acid (10 mM). All the conditions: 0.10 μg mL−1 ficin, 0.80 mM TMB, 20 mM PBS buffer (pH 5.0), and 35 °C. Error bars represent the standard deviations of three independent experiments.

