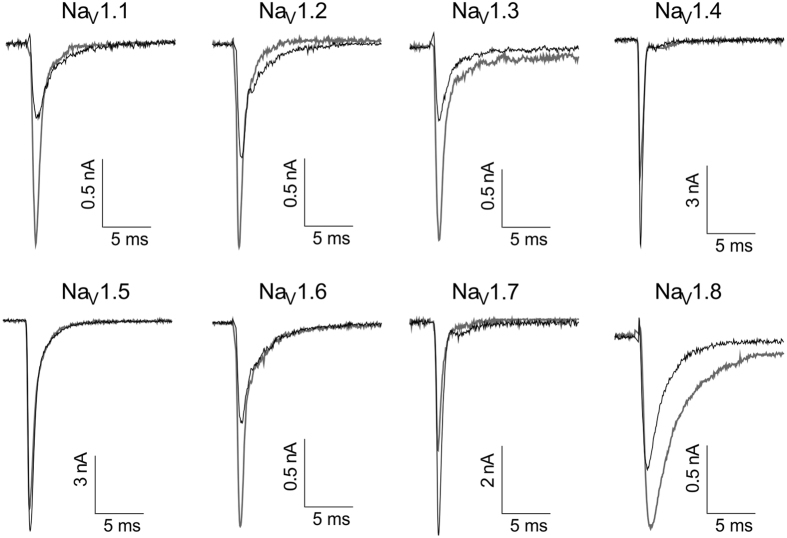
Figure 3. Representative effects of P-CTX-1 on NaV1.1–1.8 currents assessed by automated whole-cell patch clamping in mammalian cells.
Currents were elicited using a holding potential of −80 mV, followed by a pre-pulse of −100 mV for 50 ms and then a 50 ms pulse of −20 mV for NaV1.1–1.7 and +10 mV for NaV1.8. Black traces represent control current and grey traces represent current in the presence of P-CTX-1.

