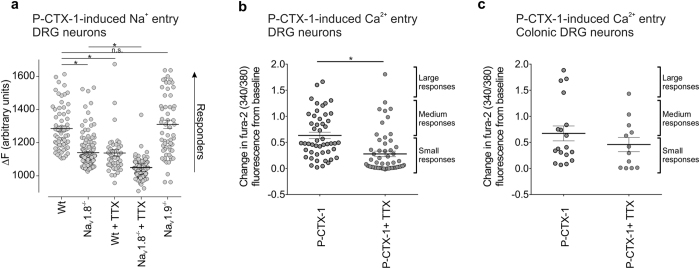
Figure 5. P-CTX-1 induced responses in isolated dorsal root ganglion neurons.
(a) Increases in intracellular Na+ in response to P-CTX-1 (1 nM) were assessed in dissociated DRG neurons from wild-type, NaV1.8−/− and NaV1.9−/− mice in the absence and presence of TTX (1 μM). P-CTX-1-induced responses were significantly (*P < 0.0001) decreased in DRGs from NaV1.8−/−, but not NaV1.9 −/− mice and after treatment with TTX. Data is presented as mean ± SEM from n = 51–163 cells/group. (b) Increases in intracellular Ca2+ in response to P-CTX-1 (1 nM) were assessed in dissociated DRG neurons from wild-type mice in the absence and presence of TTX (1 μM). P-CTX-1-induced responses were significantly decreased in DRG neurons co-incubated with TTX (*P < 0.0001). Data is presented as mean ± SEM from n = 49 neurons (P-CTX-1) and n = 57 neurons (P-CTX-1 + TTX). (c) P-CTX-induced activation of intracellular Ca2+ within identified colonic DRG neurons. Note that 1 nM P-CTX-1 induced a different magnitude of responses (small, medium and large). TTX (0.5 μM) reduced P-CTX-1-induced activation of colonic DRG neurons. This reduction was specially marked in colonic neurons exhibiting large responses when co-incubated with TTX. Data is presented as mean ± SEM from n = 18 colonic DRG neurons (P-CTX-1) and n = 12 colonic DRG neurons (P-CTX-1 + TTX). *P < 0.0001 using One-way ANOVA (a) or student’s t-test (b,c).

