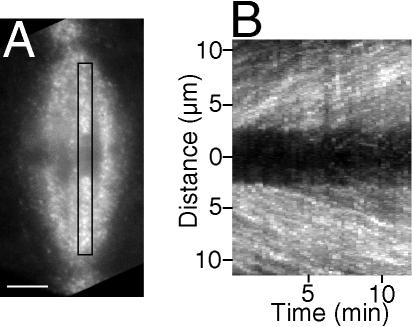
Figure 2.
3-D projection of speckle movements in kinetochore fibers. (A) The first frame of a 48-frame image stack (15-s intervals between frames) made of a spermatocyte at metaphase ∼25 min after a 2-s pulse injection of rh-tubulin; a region of interest (ROI) is defined by the rectangle, and speckle movements within it appear in the 3-D projection. Bar, 5 μm. (B) 3-D projection prepared according to the algorithm detailed in Materials and Methods using the image stack of the spermatocyte in A. Poleward movement of speckles appears as linear tracks in projections, and the slopes of the tracks are their velocities. Ordinate: distance in μm; abscissa: time in minutes. This projection contains two arrays of tracks: one array containing speckles that move up within the kinetochore fiber directed to the upper pole in A, and the other array moving down within the partner's fiber, which is directed to the lower pole.

